Greetings, hackers of the good hack!
In recent weeks, my good hack has been Guile's compiler and virtual machine. It's almost regression-free, and we're looking for a merge to master within a few weeks.
Things are looking really good. Compiled coded conses significantly less than the evaluator, loads quickly, runs quickly of course, and on top of that has all kinds of fun features. Recently we made metadata have no cost, as we write it after the program text of compiled procedures, which are normally just mmap'd from disk. (I stole this idea from a paper on Self.)
In addition to our tower of language compilers, I recently added a tower of decompilers: from value, to objcode, to bytecode, to assembly... with the possibility of adding future decompilers, potentially going all the way back to Scheme itself. We have all of the debugging information to do it nicely.
However, there are still some regressions. Probably the biggest one is that GOOPS, Guile's object system, actually loads up more slowly with the VM than with the evaluator. So I spend last week giving GOOPS a closer look.
the hunt begins
Turns out, the slowness is in the compiler. But why should the compiler be running at runtime, you ask? Well, it's the dynamic recompilation stuff I spoke of before.
GOOPS compiles implementations of methods for each set of types that it sees at runtime, which is pretty neat. The PIC paper by Hölzle, Chambers, and Ungar describe the advantages of this approach:
The presence of PIC-based [runtime] type information fundamentally alters the nature of optimization of dynamically-typed object-oriented languages. In “traditional” systems such as the current SELF compiler, type information is scarce, and consequently the compiler is designed to make the best possible use of the type information. This effort is expensive both in terms of compile time and compiled code space, since the heuristics in the compiler are tuned to spend time and space if it helps extract or preserve type information. In contrast, a PIC-based recompiling system has a veritable wealth of type information: every message has a set of likely receiver types associated with it derived from the previously compiled version’s PICs. The compiler’s heuristics and perhaps even its fundamental design should be reconsidered once the information in PICs becomes available...
(Thanks to Keith for pointing me to that paper.)
Anyway, recompilation was slow. So I then started to look at exactly why compilation was slow. I had callgrind, which is good, but doesn't give you enough information about *why* you are in those specific C procedures -- it's a C profile, not a Scheme profile. I had statprof, which is good, but doesn't give you enough information about the specific calltrees.
chartprof
So what to do? Well, since statistical profilers already have to walk the stacks, it was a simple matter to just to make statprof squirrel away the full stacks as they were sampled. Then, after the profiling run is done, you can process those stacks into call trees, and visualize that.
But how to visualize the call trees? I had some basic ideas of what I wanted, but no tool that I knew of that could present the information easily. But what I did have was an excellent toolbox: guile-cairo, and guile itself. So voilà chartprof:
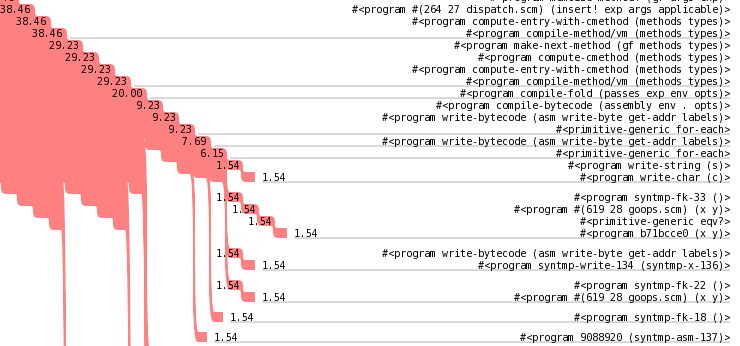
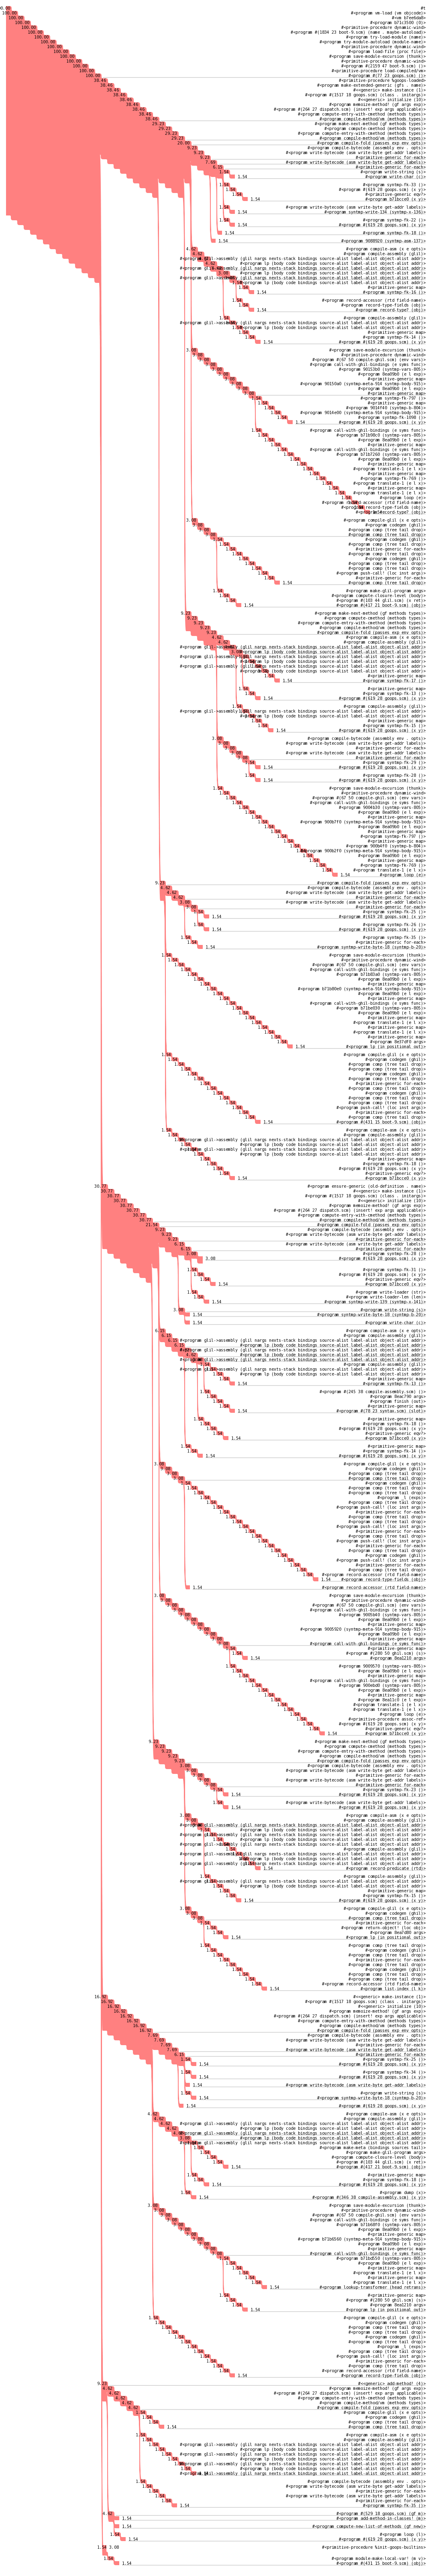
Chartprof takes full call trees and produces a representation of where the time is spent. The cascading red part represents the control flow, as nested procedure invocations, and the numbers inside the red part indicate the cumulative time percentage spent in those procedure calls. The numbers out of the red part indicate "self time", when the sampler caught program execution in that procedure instead of in one of its call children.
If you click on the thumbnail on the left, you can download the whole thing. It's big: 1.2 megabytes. There's lots of information in there, is the thing. I should figure out how to prune that information, if that can be done so usefully.
I drew horizontal lines at any call that did not always dispatch to exactly one subcall. It's interesting, you do want to line up procedures and their call sites, but you don't want too many lines. This way seems to be a good compromise, though of course it's not the last word.
analysis
It seems that the culprit is a bit unfortunate. GOOPS, when it loads, enables extensibility in about 200 of Guile's primitive procedures, e.g. equal? and for-each, which allows those procedures to dispatch to methods of generic functions. Unfortunately, this slows down pattern matching in the compilers, as the pattern matcher uses equal?, and that ends up calling out to Scheme just to see if something is equal? to a symbol... badness, that.
The equal? is particularly egregious, as a call to scm_equal_p will do a number of built-in equality checks, then if they all fail it will dispatch to the equal? generic, which dispatches to a method that calls eqv?, which does some built-in checks, then dispatches to an eqv? generic, which finally returns #f just to say that 'foo is not the same as 'bar, something that should be a quick pointer comparison.
So I'm not exactly sure what I'm going to do to fix this, but at least now I know what to think about. I would have had no clue that it was the pattern matcher if it weren't for the the graphical visualization that chartprof gave me. So yay for turning optimization into a tools problem.
code
The code is in (charting prof) from git guile-charting, which in turn needs guile-lib from git.
I'd be interested in hearing feedback about the visualizations, particularly if people have other ideas about how to visualize call graphs. I also have some other information that I could present somehow: the arguments to the procedure applications, and the source locations of the call sites.
Happy hacking!