wingologA mostly dorky weblog by Andy Wingo2012-05-29T08:07:39Ztekutihttps://wingolog.org/feed/atomAndy Wingohttps://wingolog.org/inline cache applications in schemehttps://wingolog.org/2012/05/29/inline-cache-applications-in-scheme2012-05-29T08:07:39Z2012-05-29T08:07:39Z

The inline cache is a dynamic language implementation technique that originated in Smalltalk 80 and Self, and made well-known by JavaScript implementations. It is fundamental for getting good JavaScript performance.

a cure for acute dynamic dispatch

A short summary of the way inline caches work is that when you see an operation, like x + y, you don't compile in a procedure call to a generic addition subroutine. Instead, you compile a call to a procedure stub: the inline cache (IC). When the IC is first called, it will generate a new procedure specialized to the particular types that flow through that particular call site. On the next call, if the types are the same, control flows directly to the previously computed implementation. Otherwise the process repeats, potentially resulting in a polymorphic inline cache (one with entries for more than one set of types).

An inline cache is called "inline" because it is specific to a particular call site, not to the operation. Also, adaptive optimization can later inline the stub in place of the call site, if that is considered worthwhile.

Inline caches are a win wherever you have dynamic dispatch: named field access in JavaScript, virtual method dispatch in Java, or generic arithmetic -- and here we get to Scheme.

the skeptical schemer

What is the applicability of inline caches to Scheme? The only places you have dynamic dispatch in Scheme are in arithmetic and in ports.

Let's take arithmetic first. Arithmetic operations in Scheme can operate on number of a wide array of types: fixnums, bignums, single-, double-, or multi-precision floating point numbers, complex numbers, rational numbers, etc. Scheme systems are typically compiled ahead-of-time, so in the absence of type information, you always want to inline the fixnum case and call out [of line] for other cases. (Which line is this? The line of flow control: the path traced by a program counter.) But if you end up doing a lot of floating-point math, this decision can cost you. So inline caches can be useful here.

Similarly, port operations like read-char and write can operate on any kind of port. If you are always writing UTF-8 data to a file port, you might want to be able to inline write for UTF-8 strings and file ports, possibly inlining directly to a syscall. It's probably a very small win in most cases, but a win nonetheless.

These little wins did not convince me that it was worthwhile to use ICs in a Scheme implementation, though. In the context of Guile, they're even less applicable than usual, because Guile is a bytecode-interpreted implementation with a self-hosted compiler. ICs work best when implemented as runtime-generated native code. Although it probably will by the end of the year, Guile doesn't generate native code yet. So I was skeptical.

occam's elf

Somehow, through all of this JavaScript implementation work, I managed to forget the biggest use of inline caches in GNU systems. Can you guess?

The PLT!

You may have heard how this works, but if you haven't, you're in for a treat. When you compile a shared library that has a reference to printf, from the C library, the compiler doesn't know where printf will be at runtime. So even in C, that most static of languages, we have a form of dynamic dispatch: a call to an unknown callee.

When the dynamic linker loads a library at runtime, it could resolve all the dynamic references, but instead of doing that, it does something more clever: it doesn't. Instead, the compiler and linker collude to make the call to printf call a stub -- an inline cache. The first time that stub is called, it will resolve the dynamic reference to printf, and replace the stub with an indirect call to the procedure. In this way we trade off a faster loading time for dynamic libraries at the cost of one indirection per call site, for the inline cache. This stub, this inline cache, is sometimes called the PLT entry. You might have seen it in a debugger or a disassembler or something.

I found this when I was writing an ELF linker for Guile's new virtual machine. More on that at some point in the future. ELF is interesting: I find that if I can't generate good code in the ELF format, I'm generating the wrong kind of code. Its idiosyncrasies remind me of what happens at runtime.

lambda: the ultimate inline cache

So, back to Scheme. Good Scheme implementations are careful to have only one way of calling a procedure. Since the only kind of callable object in the Scheme language is generated by the lambda abstraction, Scheme implementations typically produce uniform code for procedure application: load the procedure, prepare the arguments, and go to the procedure's entry point.

However, if you're already eating the cost of dynamic linking -- perhaps via separately compiled Scheme modules -- you might as well join the operations of "load a dynamically-linked procedure" and "go to the procedure's entry point" into a call to an inline cache, as in C shared libraries. In the cold case, the inline cache resolves the dynamic reference, updates the cache, and proceeds with the call. In the hot case, the cache directly dispatches to the call.

One benefit of this approach is that it now becomes cheap to support other kinds of applicable objects. One can make hash tables applicable, if that makes sense. (Clojure folk seem to think that it does.) Another example would be to more efficiently support dynamic programming idioms, like generic functions. Inline caches in Scheme would allow generic functions to have per-call-site caches instead of per-operation caches, which could be a big win.

It seems to me that this dynamic language implementation technique could allow Guile programmers to write different kinds of programs. The code to generate an inline cache could even itself be controlled by a meta-object protocol, so that the user could precisely control application of her objects. The mind boggles, but pleasantly so!

Thanks to Erik Corry for provoking this thought, via a conversation at JSConf EU last year. All blame to me, of course.

as PLT_HULK would say

NOW THAT'S AN APPLICATION OF AN INLINE CACHE! HA! HA HA!

Andy Wingohttps://wingolog.org/v8: a tale of two compilershttps://wingolog.org/2011/07/05/v8-a-tale-of-two-compilers2011-07-05T14:31:49Z2011-07-05T14:31:49Z

Regular readers will have noticed my fascination with the V8 JavaScript implementation. It is indeed an impressive piece of engineering.

When V8 was originally announced, Lars Bak wrote:

I hope the web community will adopt the code and the ideas we have developed to advance the performance of JavaScript. Raising the performance bar of JavaScript is important for continued innovation of web applications.

How right he was! V8 has succeeded admirably, not only in adoption, but also in "raising the performance bar" among all JavaScript implementations.

But as William Gibson says, "The future is already here — it's just not very evenly distributed." Many parts of V8 are not documented at all, and perhaps understandably, given the pace at which things are changing. So as I'm getting up to speed with V8 for my work with Igalia, I've been trying to document the interesting things that I find, so that all JavaScript implementations can learn and improve.

And indeed, with my selfish Guile hat on, this study in V8 is giving me lots of ideas and motivation. So perhaps V8's new motto should be, "shaming the world into faster code, one compiler at a time".

compiler the first: full-codegen

V8 compiles all JavaScript to native code. V8 has two compilers: one that runs fast and produces generic code, and one that doesn't run as fast but does try to produce optimized code.

The quick-and-simple compiler is known internally as the "full-codegen" compiler. It takes as its input the abstract syntax tree (AST) of a function, walks over the nodes in the AST, and emits calls to a macroassembler directly. Here's a picture:

The boxes represent the flow of data in the compilation process. There's only two boxes because, as we said, it's a simple compiler. All local variables are stored either on the stack or on the heap, not in registers. Any variable referenced by a nested function is stored on the heap, in the context object associated with the function in which the variable was defined.

The compiler will emit loads and stores to pull these values into registers to actually do the work. The top of the stack of temporaries is cached in a register. Complicated cases are handled by emitting calls to runtime procedures. The compiler does track the context in which an expression is being evaluated, so that tests can just jump directly to the consequent blocks, instead of pushing a value, testing if it's zero or not, then branching. Small integer arithmetic is usually inlined. And that's all there is!

Actually I should mention one important optimization that is done even with the full-codegen compiler, and that is inline caching. See the Hölzle, Chambers, and Ungar paper I link to there for all of the details. Inline caches are used for assignments, unary and binary operations, function calls, property accesses, and comparisons.

The inline caches also serve as sources of type information, used by the optimizing compiler. In the case of some statement types, like assignments, the only purpose of the IC is to record type information.Ed.: see the comments for a correction.

Here are some links to the source:

ast.h
The abstract syntax tree. Note that though the comment says that ASTs are allocated in separate zones, for constant-time deallocation, in practice the AST is kept around as long as the JavaScript functions are alive, for use as input to the optimizing compiler. Zone allocation is more of a win for the optimizing compiler, which produces more ephemeral garbage. Ed.: Vyacheslav Egorov writes in to say that what V8 keeps around is actually the function source, not the AST. It re-parses as needed. Makes sense. I recall Lars Bak saying in a video that source is the most compact IR there is, and indeed maybe that is the case.
full-codegen.h
full-codegen.cc
full-codegen-ia32.cc
The full-codegen compiler. Most of the meat of the full-codegen compiler is in the target-specific directory (4257 lines vs 769+1323 lines). Currently supported targets are ia32, x64, arm, and mips.

type feedback

The first time V8 sees a function, it parses it to the AST but doesn't actually do anything with it. It only runs the full-codegen compiler when the function is first run. How's that for lazy! But after things have started up, it kicks off a profiler thread to see how things are going, and what functions are hot.

This lazy, sit-back-and-watch approach gives V8 time to record the type information flowing through it. So by the time it has decided that a function is hot, and could use a little more help, it has type information to give to the compiler.

Runtime type feedback information is recorded by and stored in the inline caches (ICs). Type feedback information is expressed internally as an 8-bit value constructed in such a way that it can detect a hierarchy of types, with a simple bitmask. At this point the best I can do is show the artwork in the source:

//         Unknown
//           |   \____________
//           |                |
//      Primitive       Non-primitive
//           |   \_______     |
//           |           |    |
//        Number       String |
//         /   \         |    |
//    Double  Integer32  |   /
//        |      |      /   /
//        |     Smi    /   /
//        |      |    / __/
//        Uninitialized.

Everytime an IC stub sees a new kind of value, it computes the type of that value, and bitwise-ands it with the old type. The initial type value is uninitialized. So if an IC only sees integers in the Smi (small integer) range, the recorded type will indicate that. But as soon as it sees a double value, the type becomes Number; and if it then sees an object, the type becomes Unknown. A non-primitive IC will necessarily store the map of the receiver type in the IC, for dispatch purposes. Type feedback can parse the IC stub to get at this map, when needed. Ed.: more corrections. Thanks, Vyacheslav.

Type feedback information is associated with a particular AST node (the assignment, property load, etc.). An integer identifier for the node is serialized into the IC so that when V8 decides that a function is hot, it can parse out the recorded type information from the full-codegen code, and associate it with the AST node.

Now, this process is a bit complicated. It needs support up and down in your compiler stack. You need to have inline caches. Your inline caches need to have support for the type information, both for operands and for the result. You need to be able to walk this data to find the values. Then you need to link it back to the AST, so that when you pass the AST to your optimizing compiler, the compiler is able to ask the right questions.

The concrete strategy that V8 takes is to parse the data into a TypeFeedbackOracle object, associating information with particular AST nodes. Then V8 visits all of the AST nodes with this oracle, and the nodes themselves parse out the data that they might find useful from the oracle.

In the end one is able to, for example, ask a Property node if it is monomorphic, and in any case what are the receiver types at that node. It seems that this works well for V8, because it reduces the number of moving parts in the optimizing compiler, given that it doesn't need to have the TypeFeedbackOracle itself.

So, source links.

type-info.h
The TypeInfo 8-bit data type, and the TypeFeedbackOracle declaration. I have to admit, I really like the use of C++ within V8. It's a nasty tool, but they wield it well.
type-info.cc
The implementation of TypeFeedbackOracle. See ProcessTarget down at the bottom of the file for where the bulk of the work happens.

Also check the ast.h link before to see see how type feedback ties into the AST itself.

crankshaft = type feedback + hydrogen + lithium

Once V8 has identified that a function is hot and has collected some type feedback information, it tries to run the augmented AST through an optimizing compiler. This optimizing compiler is called Crankshaft in the marketing materials, though that name rarely appears in the source itself.

Instead, in the source, Crankshaft consists of the Hydrogen high-level intermediate representation (IR), the Lithium low-level IR, and their associated compilers. Like this:

(You probably caught on from my heavy-handed repetition above, but I believe that the names Hydrogen and Lithium come from High- and Low-level, respectively.)

It depends on your background, but you might have seen a diagram like that before:

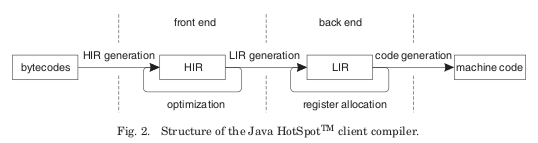
Indeed I believe that Crankshaft was highly influenced by the changes that Sun introduced into the Hotspot Client compiler in Java 6. Let me quote from an illuminating 2008 paper by Kotzmann et al, Design of the HotSpot Client Compiler for Java 6:

First, a high-level intermediate representation (HIR) of the compiled method is built via an abstract interpretation of the bytecodes. It consists of a control-flow graph (CFG), whose basic blocks are singly linked lists of instructions. The HIR is in static single- assignment (SSA) form, which means that for every variable there is just a single point in the program where a value is assigned to it. An instruction that loads or computes a value represents both the operation and its result, so that operands can be represented as pointers to previous instructions. Both during and after generation of the HIR, several optimizations are performed, such as constant folding, value numbering, method inlining, and null check elimination. They benefit from the simple structure of the HIR and the SSA form.

The back end of the compiler translates the optimized HIR into a low-level intermediate representation (LIR). The LIR is conceptually similar to machine code, but still mostly platform-independent. In contrast to HIR instructions, LIR operations operate on virtual registers instead of references to previous instructions. The LIR facilitates various low-level optimizations and is the input for the linear scan register allocator, which maps virtual registers to physical ones.

This statement describes Crankshaft very neatly, and the rest of section 2 of that paper applies in a general sense. Of course there are some differences. Crankshaft starts with the AST, not bytecodes. The HotSpot client runtime does not use type-feedback to help its compiler, as it is less necessary for Java, though it would still be helpful. Crankshaft doesn't do very much with exception handlers.

But the similarities are such that V8 can actually produce traces that can be read by c1visualizer (docs), a program used to visualize the internals of the HotSpot client compiler. (The client compiler appears to be known internally as c1; the server compiler appears to be opto).

in our next installment

This post is getting quite long. I'm going to have to send my mom some flowers or something, because I'm sure she does check these things out, and it must be brain-numbing to slog through. Another paragraph? When will he stop?

So if you, dear reader, find yourself in this category, you're in good company, because my mom is a lovely lady.

But if you're a compiler geek, I think I have at least couple more articles to write on Crankshaft before I can get back to other hacks. Specifically, we'll go into the optimizations that Crankshaft does on the Hydrogen IR, and take a look on how it does the translation to Lithium. But until then, happy hacking!

Andy Wingohttps://wingolog.org/what does v8 do with that loop?https://wingolog.org/2011/06/08/what-does-v8-do-with-that-loop2011-06-08T14:33:55Z2011-06-08T14:33:55Z

Hi!

I've spent the last month or so swimming in V8. Not the tomato juice, mind you, though that would be pleasant, but rather the JavaScript implementation.

In my last dispatch I made the assertion that the current JavaScript implementations are totally undocumented, but in the case of V8 that's not precisely true. There were at least two PhD dissertations written on it, along with a few technical reports and conference proceedings.

I refer of course to the Self work at Stanford and Sun, back in the late eighties and early nineties. I had read a number of their papers, but hadn't seen Hölzle's thesis yet. That one, for me, is the best of all, because it explains the Self implementation on an engineering level. The V8 implementation, I mean to say, because the vocabulary is entirely the same: maps, on-stack replacement, lazy deoptimization, etc. These are all parts of V8 now.

And it's no wonder, really. Lars Bak, the lead developer of V8, was there back then, hacking on Self, and then Strongtalk, then HotSpot, then a little startup built around virtual machines on mobile devices. So you see there's a reason why V8 doesn't have very much big-picture internal documentation -- Bak has been writing the same program for 20 years now; he knows how it works.

(Note however that Bak's name never appears in the V8 commit logs. You can see his hand at work, but never his face. Like Dr. Claw. Actually not very much like Dr. Claw but I just wanted to put that out there. Is Lars Bak Dr. Claw? Is he?)

enough with the personification

As you might recall, V8 always compiles JavaScript to native code. The first time V8 sees a piece of code, it compiles it quickly but without optimizing it. The initial unoptimized code is fully general, handling all of the various cases that one might see, and also includes some type-feedback code, recording what types are being seen at various points in the procedure.

At startup, if the "Crankshaft" optimizing compiler is enabled, V8 spawns off a profiling thread. If it notices that a particular unoptimized procedure is hot, it collects the recorded type feedback data for that procedure and uses it to compile an optimized version of the procedure. The old unoptimized code is then replaced with the new optimized code, and the process continues. (This on-stack replacement (OSR) process is covered in Hölzle's thesis.)

The optimized procedure does not actually cover all cases. If a callee procedure starts returning floating-point values where it was returning integer values before, the optimized procedure is deoptimized -- a relatively expensive process of recompiling the original procedure to the unoptimized form, replacing the optimized function on the stack with the unoptimized version, and then continuing the computation. This requires that the compiler keep around additional information about how to continue the computation -- you could be in the middle of a loop, after all.

Deoptimization is particularly tricky if the optimizing process inlined a callee procedure, and thus has to de-inline, replacing the activation of one optimized procedure call with two or more unoptimized calls. Again, Hölzle's thesis discusses this in depth. Inlining is such a win though that the complexity appears to be worth it.

assembly

I wanted to see what V8 does with a simple loop, but one for which lexical inlining isn't possible. Like this:

function g () { return 1; }
function f () { 
  var ret = 0;
  for (var i = 1; i < 10000000; i++) {
    ret += g ();
  }
  return ret;
}

Pretty simple: adding 1 to a counter, 10 million times, but attempting to foil statically apparent inlining possibilities. I entered these two definitions at the d8 shell, invoked with the --code_comments --print_code options.

Note that running V8 in this way is going to spew a lot on your console, as V8 itself warms up. Startup is quick, though. On my modern laptop with an SSD, the debugging shell takes about 17ms to start up. The standard shell takes about 5ms to start. Both of these numbers are with snapshots on; without snapshots, the numbers are more like 32ms and 18ms, respectively. Just for comparison, the JavaScriptCore shell (jsc) takes about 12ms to start here.

Interestingly, V8's profiler decides that the best thing to do here is not to optimize g -- which it actually can't, as it's so small the unoptimized code is already optimal -- but to inline g into f, and optimize f.

V8 is able to do this inlining because it keeps around the parsed AST of every piece of code it sees. It needs some high-level internal representation, and it turns out that the AST is the easiest one: it's fairly small, it's already the input format to the "full-codegen" unoptimized compiler, and it also has all of the lexical information necessary to do good inlining analysis. Much easier than trying to decompile bytecode, it seems to me.

I did say that I was going to show some assembly, so here we go. This is what d8 prints out when evaluating f(). I've trimmed the output a bit. The comments on the right are my annotations.

Instructions (size = 466)
  0  push rbp           ;; Save the frame pointer.
  1  movq rbp,rsp       ;; Set the new frame pointer.
  4  push rsi           ;; Save the callee's "context object".
  5  push rdi           ;; Save the callee's JSFunction object.
  6  subq rsp,0x28      ;; Reserve space for 5 locals.

Here we have a standard prelude. The JavaScript calling conventions in V8 pass arguments on the stack, using rbp and rsp as callee-saved stack and frame pointers. Additionally, information associated with the function itself is passed in rsi and rdi: the context, and the function object itself. The context is an array optimized for looking up various information that the function needs at runtime, mostly free variables (lexical and global).

In this case it's redundant to take the context out of the function, but it does allow for faster access to the global scope object that was current when the function was defined. In the case of closures, every time the function() expression is evaluated, a new context will be created with a new set of free variables.

Anyway! Moving along:

 10  movq rax,rsi        ;; Store the context in a scratch register.
 13  movq [rbp-0x38],rax ;; And save it in the last (4th) stack slot.
 17  cmpq rsp,[r13+0x0]  ;; Check for stack overflow
 21  jnc 28              ;; If we overflowed,
 23  call 0x7f7b20f40a00 ;; Call the overflow handler.

Here we store the context again, in the last stack slot, and we check for overflow. On x86-64, V8 reserves r13 for a pointer to somewhere in the middle of a "global object", holding the GC roots for a given JavaScript execution context. There is a cell in the root list that holds the stack limit, which V8 abuses for other purposes: interrupting loops, breakpoints, deoptimization, etc. Again, Hölzle's thesis has some details on this technique.

The "somewhere in the middle" bit is arranged so that a simple dereference of r13 will allow us to get at the stack limit. V8 will reset the stack limit whenever it needs to interrupt a procedure.

Having passed the stack overflow check, we initialize local variables:

 28  movq rax,[rbp+0x10] ;; Receiver object to rcx (unused).
 32  movq rcx,rax        ;;
 35  movq rdx,[rbp-0x38] ;; Global objectcontext to rdx.
 39  movl rbx,(nil)      ;; Loop counter (i) to 0.
 44  movl rax,(nil)      ;; Accumulator (ret) to 0.
 49  jmp 97              ;; Jump over some stuff.

Note that the receiver object (the this object) is passed as an argument, and thus is above rbp.

Following this bit we have some code that appears to be completely dead. I'll include it for completeness, but unless the deoptimization bailouts jump back here, I don't know why it's there.

 54  movq rax,rsi        ;; Dead code.
 57  movq rbx,[rbp-0x28]
 61  testb rbx,0x1
 64  jnz 189  (0x7f7b20fa2a7d)
 70  shrq rbx,32
 74  movq rdx,[rbp-0x30]
 78  testb rdx,0x1
 81  jnz 237  (0x7f7b20fa2aad)
 87  shrq rdx,32
 91  movq rcx,[rbp-0x18]
 95  xchgq rax, rdx

We'll just forget that happened, shall we? However we are getting closer to the firm tofu of the matter, the loop. First one more check:

 97  movq rdx,[rsi+0x2f] ;; Slot 6 of the context: the global object.
101  movq rdi,0x7f7b20e401e8 ;; Location of cell holding `g'
111  movq rdi,[rdi]      ;; Dereference cell
114  movq r10,0x7f7b205d7ba1 ;; The expected address of `g'
124  cmpq rdi,r10        ;; If they're not the same...
127  jnz 371             ;; Deoptimization bailout 2

Here we see if the current definition of g, the function that we inlined below, is actually the same as when the inlining was performed.

Note that on line 97, since pointers in V8 are low-bit tagged with 01, to access slot 6 (0-based) of the context object, we only need to add 0x2f instead of 0x30. Clever, right? But we don't actually need the global object here in the main loop, so we could have delayed this load until finding out that deoptimization was necessary. Perhaps it was needed though for GC reasons.

133  movq rdx,[rdx+0x27] ;; Another redundant load.
137  cmpl rbx,0x989680   ;; 10000000, you see.
143  jge 178             ;; If i >= 10000000, break.
149  movq rdx,rax        ;; tmp = ret
152  addl rdx,0x1        ;; tmp += 1
155  jo 384              ;; On overflow, deoptimize.
161  addl rbx,0x1        ;; i++
164  movq rax,rdx        ;; ret = tmp
167  cmpq rsp,[r13+0x0]  ;; Reload stack limit.
171  jnc 137             ;; Loop if no interrupt,
173  jmp 306             ;; Otherwise bail out.
178  shlq rax,32         ;; Tag rax as a small integer.
182  movq rsp,rbp        ;; Restore stack pointer.
185  pop rbp             ;; Restore frame pointer.
186  ret 0x8             ;; Return, popping receiver.

And that's it! It's a fairly tight loop: g is inlined of course, its return value is untagged to a native int32, as are the accumulator and loop counter variables. Of course, improvements are possible -- the loop could be unrolled a few times, range analysis could avoid the deoptimization check, the overflow check could possibly be cheaper, and indeed the whole thing could be folded, but all in all, good job, MAD kittens!

Note the interesting approach to tagging: instead of storing the integer in the lower 32 bits, shifted by one, it is stored in the upper 32 bits, without a shift.

Actually there's some more junk after all of this. Another dead code block, apparently meaning to deal with floating-point values, but totally unreferenced:

189  movq r10,[r13-0x38]
193  cmpq [rbx-0x1],r10
197  jnz 397
203  movsd xmm0,[rbx+0x7]
208  cvttsd2sil rbx,xmm0
212  cvtsi2sd xmm1,rbx
216  ucomisd xmm0,xmm1
220  jnz 397
226  jpe 397
232  jmp 74
237  movq r10,[r13-0x38]
241  cmpq [rdx-0x1],r10
245  jnz 410
251  movsd xmm0,[rdx+0x7]
256  cvttsd2sil rdx,xmm0
260  cvtsi2sd xmm1,rdx
264  ucomisd xmm0,xmm1
268  jnz 410
274  jpe 410
280  testl rdx,rdx
282  jnz 301
288  movmskpd xmm2,xmm0
292  andl rdx,0x1
295  jnz 410
301  jmp 91

And then there's our stack check handler, saving all of the registers of interest, and calling out:

306  push rax
307  push rcx
308  push rdx
309  push rbx
310  push rsi
311  push rdi
312  push r8
314  push r9
316  push r11
318  push r14
320  push r15
322  leaq rsp,[rsp-0x28]
327  movq rsi,[rbp-0x8]
331  xorl rax,rax
333  leaq rbx,[r13-0x20a4b70]
340  call 0x7f7b20fa25c0
345  leaq rsp,[rsp+0x28]
350  pop r15
352  pop r14
354  pop r11
356  pop r9
358  pop r8
360  pop rdi
361  pop rsi
362  pop rbx
363  pop rdx
364  pop rcx
365  pop rax
366  jmp 137

And finally the deoptimization bailouts:

371  movq r10,0x7f7b20f7c054
381  jmp r10
384  movq r10,0x7f7b20f7c05e
394  jmp r10
397  movq r10,0x7f7b20f7c068
407  jmp r10
410  movq r10,0x7f7b20f7c072
420  jmp r10

Whew! I'd say that's long enough for today. I wanted to establish a fixed point on the low level though, so that I could write in the future about how it is that V8 compiles down to this code, what deoptimization is about, and such; filling in the middle, between the assembly and the JavaScript source. Corrections and suggestions in the comments please. Happy hacking!

Andy Wingohttps://wingolog.org/dynamic dispatch: a followuphttps://wingolog.org/2008/10/19/dynamic-dispatch-a-followup2008-10-19T22:40:00Z2008-10-19T22:40:00Z

It seems that the 8-hash technique for dynamic dispatch that I mentioned in my last essay actually has a longer pedigree. At least 10 years before GOOPS' implementation, the always-excellent Gregor Kiczales wrote, with Luis H Rodriguez Jr.:

If we increase the size class wrappers slightly, we can add more hash seeds to each wrapper. If n is the number of hash seeds stored in each wrapper, we can think of each generic function selecting some number x less than n and using the xth hash seed from each wrapper. Currently we store 8 hash seeds in each wrapper, resulting in very low average probe depths.

The additional hash seeds increase the probability that a generic function will be able to have a low average probe depth in its memoization table. If one set of seeds doesn't produce a good distribution, the generic function can select one of the other sets instead. In effect, we are increasing the size of class wrappers in order to decrease the size of generic function memoization tables. This tradeoff is attractive since typical systems seem to have between three and five times as many generic functions as classes.

Efficient method dispatch in PCL

So it seems that Mikael Djurfeldt, the GOOPS implementor, appears to have known about CLOS implementation strategies. But it's interesting how this knowledge percolates out -- it's not part of the computer science canon. When you read these papers, it's always "Personal communication from Dave Moon this" and "I know about this Kiczales paper that". (Now you do too.)

Also interesting about the Kiczales paper is the focus on the user, the programmer, in the face of redefinitions -- truly a different culture than the one that is dominant now.

polymorphic inline caches buzz buzz buzz

This reference comes indirectly via Keith Rarick, who writes to mention a beautiful paper by Hölzle, Chambers, and Ungar, introducing polymorphic inline caches, a mechanism to dispatch based on runtime types, as GOOPS does.

PICs take dispatch one step further: instead of indirect table lookups as GOOPS does, a PIC is a runtime-generated procedure that performs the lookups directly in code. This difference between data-driven processing and direct execution is the essence of compilation -- compilation pushes all of the caching and branching logic as close to the metal as possible.

Furthermore, PICs can be a source of data as well as a dispatch mechanism:

The presence of PIC-based type information fundamentally alters the nature of optimization of dynamically-typed object-oriented languages. In “traditional” systems such as the current SELF compiler, type information is scarce, and consequently the compiler is designed to make the best possible use of the type information. This effort is expensive both in terms of compile time and compiled code space, since the heuristics in the compiler are tuned to spend time and space if it helps extract or preserve type information. In contrast, a PIC-based recompiling system has a veritable wealth of type information: every message has a set of likely receiver types associated with it derived from the previously compiled version’s PICs. The compiler’s heuristics and perhaps even its fundamental design should be reconsidered once the information in PICs becomes available [...].

Optimizing Dynamically-Typed Object-Oriented Programming Languages with Polymorphic Inline Caches

The salient point is that in latent-typed languages, all of the static type analysis techniques that we know are insufficient. Only runtime analysis and runtime recompilation can capture the necessary information for efficient compilation.

Read both of these articles! But if you just read one, make it the Ungar/Chambers/Hölzle -- it is well-paced, clearly-written, and illuminating.

Happy hacking!