wingologA mostly dorky weblog by Andy Wingo2023-11-24T11:41:37Ztekutihttps://wingolog.org/feed/atomAndy Wingohttps://wingolog.org/tree-shaking, the horticulturally misguided algorithmhttps://wingolog.org/2023/11/24/tree-shaking-the-horticulturally-misguided-algorithm2023-11-24T11:41:37Z2023-11-24T11:41:37Z

Let’s talk about tree-shaking!

looking up from the trough

But first, I need to talk about WebAssembly’s dirty secret: despite the hype, WebAssembly has had limited success on the web.

There is Photoshop, which does appear to be a real success. 5 years ago there was Figma, though they don’t talk much about Wasm these days. There are quite a number of little NPM libraries that use Wasm under the hood, usually compiled from C++ or Rust. I think Blazor probably gets used for a few in-house corporate apps, though I could be fooled by their marketing.

You might recall the hyped demos of 3D first-person-shooter games with Unreal engine again from 5 years ago, but that was the previous major release of Unreal and was always experimental; the current Unreal 5 does not support targetting WebAssembly.

Don’t get me wrong, I think WebAssembly is great. It is having fine success in off-the-web environments, and I think it is going to be a key and growing part of the Web platform. I suspect, though, that we are only just now getting past the trough of disillusionment.

It’s worth reflecting a bit on the nature of web Wasm’s successes and failures. Taking Photoshop as an example, I think we can say that Wasm does very well at bringing large C++ programs to the web. I know that it took quite some work, but I understand the end result to be essentially the same source code, just compiled for a different target.

Similarly for the JavaScript module case, Wasm finds success in getting legacy C++ code to the web, and as a way to write new web-targetting Rust code. These are often tasks that JavaScript doesn’t do very well at, or which need a shared implementation between client and server deployments.

On the other hand, WebAssembly has not been a Web success for DOM-heavy apps. Nobody is talking about rewriting the front-end of wordpress.com in Wasm, for example. Why is that? It may sound like a silly question to you: Wasm just isn’t good at that stuff. But why? If you dig down a bit, I think it’s that the programming models are just too different: the Web’s primary programming model is JavaScript, a language with dynamic typing and managed memory, whereas WebAssembly 1.0 was about static typing and linear memory. Getting to the DOM from Wasm was a hassle that was overcome only by the most ardent of the true Wasm faithful.

Relatedly, Wasm has also not really been a success for languages that aren’t, like, C or Rust. I am guessing that wordpress.com isn’t written mostly in C++. One of the sticking points for this class of language. is that C#, for example, will want to ship with a garbage collector, and that it is annoying to have to do this. Check my article from March this year for more details.

Happily, this restriction is going away, as all browsers are going to ship support for reference types and garbage collection within the next months; Chrome and Firefox already ship Wasm GC, and Safari shouldn’t be far behind thanks to the efforts from my colleague Asumu Takikawa. This is an extraordinarily exciting development that I think will kick off a whole ‘nother Gartner hype cycle, as more languages start to update their toolchains to support WebAssembly.

if you don’t like my peaches

Which brings us to the meat of today’s note: web Wasm will win where compilers create compact code. If your language’s compiler toolchain can manage to produce useful Wasm in a file that is less than a handful of over-the-wire kilobytes, you can win. If your compiler can’t do that yet, you will have to instead rely on hype and captured audiences for adoption, which at best results in an unstable equilibrium until you figure out what’s next.

In the JavaScript world, managing bloat and deliverable size is a huge industry. Bundlers like esbuild are a ubiquitous part of the toolchain, compiling down a set of JS modules to a single file that should include only those functions and data types that are used in a program, and additionally applying domain-specific size-squishing strategies such as minification (making monikers more minuscule).

Let’s focus on tree-shaking. The visual metaphor is that you write a bunch of code, and you only need some of it for any given page. So you imagine a tree whose, um, branches are the modules that you use, and whose leaves are the individual definitions in the modules, and you then violently shake the tree, probably killing it and also annoying any nesting birds. The only thing that’s left still attached is what is actually needed.

This isn’t how trees work: holding the trunk doesn’t give you information as to which branches are somehow necessary for the tree’s mission. It also primes your mind to look for the wrong fixed point, removing unneeded code instead of keeping only the necessary code.

But, tree-shaking is an evocative name, and so despite its horticultural and algorithmic inaccuracies, we will stick to it.

The thing is that maximal tree-shaking for languages with a thicker run-time has not been a huge priority. Consider Go: according to the golang wiki, the most trivial program compiled to WebAssembly from Go is 2 megabytes, and adding imports can make this go to 10 megabytes or more. Or look at Pyodide, the Python WebAssembly port: the REPL example downloads about 20 megabytes of data. These are fine sizes for technology demos or, in the limit, very rich applications, but they aren’t winners for web development.

shake a different tree

To be fair, both the built-in Wasm support for Go and the Pyodide port of Python both derive from the upstream toolchains, where producing small binaries is nice but not necessary: on a server, who cares how big the app is? And indeed when targetting smaller devices, we tend to see alternate implementations of the toolchain, for example MicroPython or TinyGo. TinyGo has a Wasm back-end that can apparently go down to less than a kilobyte, even!

These alternate toolchains often come with some restrictions or peculiarities, and although we can consider this to be an evil of sorts, it is to be expected that the target platform exhibits some co-design feedback on the language. In particular, running in the sea of the DOM is sufficiently weird that a Wasm-targetting Python program will necessarily be different than a “native” Python program. Still, I think as toolchain authors we aim to provide the same language, albeit possibly with a different implementation of the standard library. I am sure that the ClojureScript developers would prefer to remove their page documenting the differences with Clojure if they could, and perhaps if Wasm becomes a viable target for Clojurescript, they will.

on the algorithm

To recap: now that it supports GC, Wasm could be a winner for web development in Python and other languages. You would need a different toolchain and an effective tree-shaking algorithm, so that user experience does not degrade. So let’s talk about tree shaking!

I work on the Hoot Scheme compiler, which targets Wasm with GC. We manage to get down to 70 kB or so right now, in the minimal “main” compilation unit, and are aiming for lower; auxiliary compilation units that import run-time facilities (the current exception handler and so on) from the main module can be sub-kilobyte. Getting here has been tricky though, and I think it would be even trickier for Python.

Some background: like Whiffle, the Hoot compiler prepends a prelude onto user code. Tree-shakind happens in a number of places:

Generally speaking, procedure definitions (functions / closures) are the easy part: you just include only those functions that are referenced by the code. In a language like Scheme, this gets you a long way.

However there are three immediate challenges. One is that the evaluation model for the definitions in the prelude is letrec*: the scope is recursive but ordered. Binding values can call or refer to previously defined values, or capture values defined later. If evaluating the value of a binding requires referring to a value only defined later, then that’s an error. Again, for procedures this is trivially OK, but as soon as you have non-procedure definitions, sometimes the compiler won’t be able to prove this nice “only refers to earlier bindings” property. In that case the fixing letrec (reloaded) algorithm will end up residualizing bindings that are set!, which of all the tree-shaking passes above require the delicate DCE pass to remove them.

Worse, some of those non-procedure definitions are record types, which have vtables that define how to print a record, how to check if a value is an instance of this record, and so on. These vtable callbacks can end up keeping a lot more code alive even if they are never used. We’ll get back to this later.

Similarly, say you print a string via display. Well now not only are you bringing in the whole buffered I/O facility, but you are also calling a highly polymorphic function: display can print anything. There’s a case for bitvectors, so you pull in code for bitvectors. There’s a case for pairs, so you pull in that code too. And so on.

One solution is to instead call write-string, which only writes strings and not general data. You’ll still get the generic buffered I/O facility (ports), though, even if your program only uses one kind of port.

This brings me to my next point, which is that optimal tree-shaking is a flow analysis problem. Consider display: if we know that a program will never have bitvectors, then any code in display that works on bitvectors is dead and we can fold the branches that guard it. But to know this, we have to know what kind of arguments display is called with, and for that we need higher-level flow analysis.

The problem is exacerbated for Python in a few ways. One, because object-oriented dispatch is higher-order programming. How do you know what foo.bar actually means? Depends on foo, which means you have to thread around representations of what foo might be everywhere and to everywhere’s caller and everywhere’s caller’s caller and so on.

Secondly, lookup in Python is generally more dynamic than in Scheme: you have __getattr__ methods (is that it?; been a while since I’ve done Python) everywhere and users might indeed use them. Maybe this is not so bad in practice and flow analysis can exclude this kind of dynamic lookup.

Finally, and perhaps relatedly, the object of tree-shaking in Python is a mess of modules, rather than a big term with lexical bindings. This is like JavaScript, but without the established ecosystem of tree-shaking bundlers; Python has its work cut out for some years to go.

in short

With GC, Wasm makes it thinkable to do DOM programming in languages other than JavaScript. It will only be feasible for mass use, though, if the resulting Wasm modules are small, and that means significant investment on each language’s toolchain. Often this will take the form of alternate toolchains that incorporate experimental tree-shaking algorithms, and whose alternate standard libraries facilitate the tree-shaker.

Welp, I’m off to lunch. Happy wassembling, comrades!

Andy Wingohttps://wingolog.org/requiem for a stringrefhttps://wingolog.org/2023/10/19/requiem-for-a-stringref2023-10-19T10:33:58Z2023-10-19T10:33:58Z

Good day, comrades. Today’s missive is about strings!

a problem for java

Imagine you want to compile a program to WebAssembly, with the new GC support for WebAssembly. Your WebAssembly program will run on web browsers and render its contents using the DOM API: Document.createElement, Document.createTextNode, and so on. It will also use DOM interfaces to read parts of the page and read input from the user.

How do you go about representing your program in WebAssembly? The GC support gives you the ability to define a number of different kinds of aggregate data types: structs (records), arrays, and functions-as-values. Earlier versions of WebAssembly gave you 32- and 64-bit integers, floating-point numbers, and opaque references to host values (externref). This is what you have in your toolbox. But what about strings?

WebAssembly’s historical answer has been to throw its hands in the air and punt the problem to its user. This isn’t so bad: the direct user of WebAssembly is a compiler developer and can fend for themself. Using the primitives above, it’s clear we should represent strings as some kind of array.

The source language may impose specific requirements regarding string representations: for example, in Java, you will want to use an (array i16), because Java’s strings are specified as sequences of UTF-16¹ code units, and Java programs are written assuming that random access to a code unit is constant-time.

Let’s roll with the Java example for a while. It so happens that JavaScript, the main language of the web, also specifies strings in terms of 16-bit code units. The DOM interfaces are optimized for JavaScript strings, so at some point, our WebAssembly program is going to need to convert its (array i16) buffer to a JavaScript string. You can imagine that a high-throughput interface between WebAssembly and the DOM is going to involve a significant amount of copying; could there be a way to avoid this?

Similarly, Java is going to need to perform a number of gnarly operations on its strings, for example, locale-specific collation. This is a hard problem whose solution basically amounts to shipping a copy of libICU in their WebAssembly module; that’s a lot of binary size, and it’s not even clear how to compile libICU in such a way that works on GC-managed arrays rather than linear memory.

Thinking about it more, there’s also the problem of regular expressions. A high-performance regular expression engine is a lot of investment, and not really portable from the native world to WebAssembly, as the main techniques require just-in-time code generation, which is unavailable on Wasm.

This is starting to sound like a terrible system: big binaries, lots of copying, suboptimal algorithms, and a likely ongoing functionality gap. What to do?

a solution for java

One observation is that in the specific case of Java, we could just use JavaScript strings in a web browser, instead of implementing our own string library. We may need to make some shims here and there, but the basic functionality from JavaScript gets us what we need: constant-time UTF-16¹ code unit access from within WebAssembly, and efficient access to browser regular expression, internationalization, and DOM capabilities that doesn’t require copying.

A sort of minimum viable product for improving the performance of Java compiled to Wasm/GC would be to represent strings as externref, which is WebAssembly’s way of making an opaque reference to a host value. You would operate on those values by importing the equivalent of String.prototype.charCodeAt and friends; to get the receivers right you’d need to run them through Function.call.bind. It’s a somewhat convoluted system, but a WebAssembly engine could be taught to recognize such a function and compile it specially, using the same code that JavaScript compiles to.

(Does this sound too complicated or too distasteful to implement? Disabuse yourself of the notion: it’s happening already. V8 does this and other JS/Wasm engines will be forced to follow, as users file bug reports that such-and-such an app is slow on e.g. Firefox but fast on Chrome, and so on and so on. It’s the same dynamic that led asm.js adoption.)

Getting properly good performance will require a bit more, though. String literals, for example, would have to be loaded from e.g. UTF-8 in a WebAssembly data section, then transcoded to a JavaScript string. You need a function that can convert UTF-8 to JS string in the first place; let’s call it fromUtf8Array. An engine can now optimize the array.new_data + fromUtf8Array sequence to avoid the intermediate array creation. It would also be nice to tighten up the typing on the WebAssembly side: having everything be externref imposes a dynamic type-check on each operation, which is something that can’t always be elided.

beyond the web?

“JavaScript strings for Java” has two main limitations: JavaScript and Java. On the first side, this MVP doesn’t give you anything if your WebAssembly host doesn’t do JavaScript. Although it’s a bit of a failure for a universal virtual machine, to an extent, the WebAssembly ecosystem is OK with this distinction: there are different compiler and toolchain options when targetting the web versus, say, Fastly’s edge compute platform.

But does that mean you can’t run Java on Fastly’s cloud? Does the Java compiler have to actually implement all of those things that we were trying to avoid? Will Java actually implement those things? I think the answers to all of those questions is “no”, but also that I expect a pretty crappy outcome.

First of all, it’s not technically required that Java implement its own strings in terms of (array i16). A Java-to-Wasm/GC compiler can keep the strings-as-opaque-host-values paradigm, and instead have these string routines provided by an auxiliary WebAssembly module that itself probably uses (array i16), effectively polyfilling what the browser would give you. The effort of creating this module can be shared between e.g. Java and C#, and the run-time costs for instantiating the module can be amortized over a number of Java users within a process.

However, I don’t expect such a module to be of good quality. It doesn’t seem possible to implement a good regular expression engine that way, for example. And, absent a very good run-time system with an adaptive compiler, I don’t expect the low-level per-codepoint operations to be as efficient with a polyfill as they are on the browser.

Instead, I could see non-web WebAssembly hosts being pressured into implementing their own built-in UTF-16¹ module which has accelerated compilation, a native regular expression engine, and so on. It’s nice to have a portable fallback but in the long run, first-class UTF-16¹ will be everywhere.

beyond java?

The other drawback is Java, by which I mean, Java (and JavaScript) is outdated: if you were designing them today, their strings would not be UTF-16¹.

I keep this little “¹” sigil when I mention UTF-16 because Java (and JavaScript) don’t actually use UTF-16 to represent their strings. UTF-16 is standard Unicode encoding form. A Unicode encoding form encodes a sequence of Unicode scalar values (USVs), using one or two 16-bit code units to encode each USV. A USV is a codepoint: an integer in the range [0,0x10FFFF], but excluding surrogate codepoints: codepoints in the range [0xD800,0xDFFF].

Surrogate codepoints are an accident of history, and occur either when accidentally slicing a two-code-unit UTF-16-encoded-USV in the middle, or when treating an arbitrary i16 array as if it were valid UTF-16. They are annoying to detect, but in practice are here to stay: no amount of wishing will make them go away from Java, JavaScript, C#, or other similar languages from those heady days of the mid-90s. Believe me, I have engaged in some serious wishing, but if you, the virtual machine implementor, want to support Java as a source language, your strings have to be accessible as 16-bit code units, which opens the door (eventually) to surrogate codepoints.

So when I say UTF-16¹, I really mean WTF-16: sequences of any 16-bit code units, without the UTF-16 requirement that surrogate code units be properly paired. In this way, WTF-16 encodes a larger language than UTF-16: not just USV codepoints, but also surrogate codepoints.

The existence of WTF-16 is a consequence of a kind of original sin, originating in the choice to expose 16-bit code unit access to the Java programmer, and which everyone agrees should be somehow firewalled off from the rest of the world. The usual way to do this is to prohibit WTF-16 from being transferred over the network or stored to disk: a message sent via an HTTP POST, for example, will never include a surrogate codepoint, and will either replace it with the U+FFFD replacement codepoint or throw an error.

But within a Java program, and indeed within a JavaScript program, there is no attempt to maintain the UTF-16 requirements regarding surrogates, because any change from the current behavior would break programs. (How many? Probably very, very few. But productively deprecating web behavior is hard to do.)

If it were just Java and JavaScript, that would be one thing, but WTF-16 poses challenges for using JS strings from non-Java languages. Consider that any JavaScript string can be invalid UTF-16: if your language defines strings as sequences of USVs, which excludes surrogates, what do you do when you get a fresh string from JS? Passing your string to JS is fine, because WTF-16 encodes a superset of USVs, but when you receive a string, you need to have a plan.

You only have a few options. You can eagerly check that a string is valid UTF-16; this might be a potentially expensive O(n) check, but perhaps this is acceptable. (This check may be faster in the future.) Or, you can replace surrogate codepoints with U+FFFD, when accessing string contents; lossy, but preserves your language’s semantic domain. Or, you can extend your language’s semantics to somehow deal with surrogate codepoints.

My point is that if you want to use JS strings in a non-Java-like language, your language will need to define what to do with invalid UTF-16. Ideally the browser will give you a way to put your policy into practice: replace with U+FFFD, error, or pass through.

beyond java? (reprise) (feat: snakes)

With that detail out of the way, say you are compiling Python to Wasm/GC. Python’s language reference says: “A string is a sequence of values that represent Unicode code points. All the code points in the range U+0000 - U+10FFFF can be represented in a string.” This corresponds to the domain of JavaScript’s strings; great!

On second thought, how do you actually access the contents of the string? Surely not via the equivalent of JavaScript’s String.prototype.charCodeAt; Python strings are sequences of codepoints, not 16-bit code units.

Here we arrive to the second, thornier problem, which is less about domain and more about idiom: in Python, we expect to be able to access strings by codepoint index. This is the case not only to access string contents, but also to refer to positions in strings, for example when extracting a substring. These operations need to be fast (or fast enough anyway; CPython doesn’t have a very high performance baseline to meet).

However, the web platform doesn’t give us O(1) access to string codepoints. Usually a codepoint just takes up one 16-bit code unit, so the (zero-indexed) 5th codepoint of JS string s may indeed be at s.codePointAt(5), but it may also be at offset 6, 7, 8, 9, or 10. You get the point: finding the nth codepoint in a JS string requires a linear scan from the beginning.

More generally, all languages will want to expose O(1) access to some primitive subdivision of strings. For Rust, this is bytes; 8-bit bytes are the code units of UTF-8. For others like Java or C#, it’s 16-bit code units. For Python, it’s codepoints. When targetting JavaScript strings, there may be a performance impedance mismatch between what the platform offers and what the language requires.

Languages also generally offer some kind of string iteration facility, which doesn’t need to correspond to how a JavaScript host sees strings. In the case of Python, one can implement for char in s: print(char) just fine on top of JavaScript strings, by decoding WTF-16 on the fly. Iterators can also map between, say, UTF-8 offsets and WTF-16 offsets, allowing e.g. Rust to preserve its preferred “strings are composed of bytes that are UTF-8 code units” abstraction.

Our O(1) random access problem remains, though. Are we stuck?

what does the good world look like

How should a language represent its strings, anyway? Here we depart from a precise gathering of requirements for WebAssembly strings, but in a useful way, I think: we should build abstractions not only for what is, but also for what should be. We should favor a better future; imagining the ideal helps us design the real.

I keep returning to Henri Sivonen’s authoritative article, It’s Not Wrong that “🤦🏼‍♂️”.length == 7, But It’s Better that “🤦🏼‍♂️”.len() == 17 and Rather Useless that len(“🤦🏼‍♂️”) == 5. It is so good and if you have reached this point, pop it open in a tab and go through it when you can. In it, Sivonen argues (among other things) that random access to codepoints in a string is not actually important; he thinks that if you were designing Python today, you wouldn’t include this interface in its standard library. Users would prefer extended grapheme clusters, which is variable-length anyway and a bit gnarly to compute; storage wants bytes; array-of-codepoints is just a bad place in the middle. Given that UTF-8 is more space-efficient than either UTF-16 or array-of-codepoints, and that it embraces the variable-length nature of encoding, programming languages should just use that.

As a model for how strings are represented, array-of-codepoints is outdated, as indeed is UTF-16. Outdated doesn’t mean irrelevant, of course; there is lots of Python code out there and we have to support it somehow. But, if we are designing for the future, we should nudge our users towards other interfaces.

There is even a case that a JavaScript engine should represent its strings as UTF-8 internally, despite the fact that JS exposes a UTF-16 view on strings in its API. The pitch is that UTF-8 takes less memory, is probably what we get over the network anyway, and is probably what many of the low-level APIs that a browser uses will want; it would be faster and lighter-weight to pass UTF-8 to text shaping libraries, for example, compared to passing UTF-16 or having to copy when going to JS and when going back. JavaScript engines already have a dozen internal string representations or so (narrow or wide, cons or slice or flat, inline or external, interned or not, and the product of many of those); adding another is just a Small Matter Of Programming that could show benefits, even if some strings have to be later transcoded to UTF-16 because JS accesses them in that way. I have talked with JS engine people in all the browsers and everyone thinks that UTF-8 has a chance at being a win; the drawback is that actually implementing it would take a lot of effort for uncertain payoff.

I have two final data-points to indicate that UTF-8 is the way. One is that Swift used to use UTF-16 to represent its strings, but was able to switch to UTF-8. To adapt to the newer performance model of UTF-8, Swift maintainers designed new APIs to allow users to request a view on a string: treat this string as UTF-8, or UTF-16, or a sequence of codepoints, or even a sequence of extended grapheme clusters. Their users appear to be happy, and I expect that many languages will follow Swift’s lead.

Secondly, as a maintainer of the Guile Scheme implementation, I also want to switch to UTF-8. Guile has long used Python’s representation strategy: array of codepoints, with an optimization if all codepoints are “narrow” (less than 256). The Scheme language exposes codepoint-at-offset (string-ref) as one of its fundamental string access primitives, and array-of-codepoints maps well to this idiom. However, we do plan to move to UTF-8, with a Swift-like breadcrumbs strategy for accelerating per-codepoint access. We hope to lower memory consumption, simplify the implementation, and have general (but not uniform) speedups; some things will be slower but most should be faster. Over time, users will learn the performance model and adapt to prefer string builders / iterators (“string ports”) instead of string-ref.

a solution for webassembly in the browser?

Let’s try to summarize: it definitely makes sense for Java to use JavaScript strings when compiled to WebAssembly/GC, when running on the browser. There is an OK-ish compilation strategy for this use case involving externref, String.prototype.charCodeAt imports, and so on, along with some engine heroics to specially recognize these operations. There is an early proposal to sand off some of the rough edges, to make this use-case a bit more predictable. However, there are two limitations:

  1. Focussing on providing JS strings to Wasm/GC is only really good for Java and friends; the cost of mapping charCodeAt semantics to, say, Python’s strings is likely too high.

  2. JS strings are only present on browsers (and Node and such).

I see the outcome being that Java will have to keep its implementation that uses (array i16) when targetting the edge, and use JS strings on the browser. I think that polyfills will not have acceptable performance. On the edge there will be a binary size penalty and a performance and functionality gap, relative to the browser. Some edge Wasm implementations will be pushed to implement fast JS strings by their users, even though they don’t have JS on the host.

If the JS string builtins proposal were a local maximum, I could see putting some energy into it; it does make the Java case a bit better. However I think it’s likely to be an unstable saddle point; if you are going to infect the edge with WTF-16 anyway, you might as well step back and try to solve a problem that is a bit more general than Java on JS.

stringref: a solution for webassembly?

I think WebAssembly should just bite the bullet and try to define a string data type, for languages that use GC. It should support UTF-8 and UTF-16 views, like Swift’s strings, and support some kind of iterator API that decodes codepoints.

It should be abstract as regards the concrete representation of strings, to allow JavaScript strings to stand in for WebAssembly strings, in the context of the browser. JS hosts will use UTF-16 as their internal representation. Non-JS hosts will likely prefer UTF-8, and indeed an abstract API favors migration of JS engines away from UTF-16 over the longer term. And, such an abstraction should give the user control over what to do for surrogates: allow them, throw an error, or replace with U+FFFD.

What I describe is what the stringref proposal gives you. We don’t yet have consensus on this proposal in the Wasm standardization group, and we may never reach there, although I think it’s still possible. As I understand them, the objections are two-fold:

  1. WebAssembly is an instruction set, like AArch64 or x86. Strings are too high-level, and should be built on top, for example with (array i8).

  2. The requirement to support fast WTF-16 code unit access will mean that we are effectively standardizing JavaScript strings.

I think the first objection is a bit easier to overcome. Firstly, WebAssembly now defines quite a number of components that don’t map to machine ISAs: typed and extensible locals, memory.copy, and so on. You could have defined memory.copy in terms of primitive operations, or required that all local variables be represented on an explicit stack or in a fixed set of registers, but WebAssembly defines higher-level interfaces that instead allow for more efficient lowering to machine primitives, in this case SIMD-accelerated copies or machine-specific sets of registers.

Similarly with garbage collection, there was a very interesting “continuation marks” proposal by Ross Tate that would give a low-level primitive on top of which users could implement root-finding of stack values. However when choosing what to include in the standard, the group preferred a more high-level facility in which a Wasm module declares managed data types and allows the WebAssembly implementation to do as it sees fit. This will likely result in more efficient systems, as a Wasm implementation can more easily use concurrency and parallelism in the GC implementation than a guest WebAssembly module could do.

So, the criteria of what to include in the Wasm standard is not “what is the most minimal primitive that can express this abstraction”, or even “what looks like an ARMv8 instruction”, but rather “what makes Wasm a good compilation target”. Wasm is designed for its compiler-users, not for the machines that it runs on, and if we manage to find an abstract definition of strings that works for Wasm-targetting toolchains, we should think about adding it.

The second objection is trickier. When you compile to Wasm, you need a good model of what the performance of the Wasm code that you emit will be. Different Wasm implementations may use different stringref representations; requesting a UTF-16 view on a string that is already UTF-16 will be cheaper than doing so on a string that is UTF-8. In the worst case, requesting a UTF-16 view on a UTF-8 string is a linear operation on one system but constant-time on another, which in a loop over string contents makes the former system quadratic: a real performance failure that we need to design around.

The stringref proposal tries to reify as much of the cost model as possible with its “view” abstraction; the compiler can reason that any cost may incur then rather than when accessing a view. But, this abstraction can leak, from a performance perspective. What to do?

I think that if we look back on what the expected outcome of the JS-strings-for-Java proposal is, I believe that if Wasm succeeds as a target for Java, we will probably already end up with WTF-16 everywhere. We might as well admit this, I think, and if we do, then this objection goes away. Likewise on the Web I see UTF-8 as being potentially advantageous in the medium-long term for JavaScript, and certainly better for other languages, and so I expect JS implementations to also grow support for fast UTF-8.

i’m on a horse

I may be off in some of my predictions about where things will go, so who knows. In the meantime, in the time that it takes other people to reach the same conclusions, stringref is in a kind of hiatus.

The Scheme-to-Wasm compiler that I work on does still emit stringref, but it is purely a toolchain concept now: we have a post-pass that lowers stringref to WTF-8 via (array i8), and which emits calls to host-supplied conversion routines when passing these strings to and from the host. When compiling to Hoot’s built-in Wasm virtual machine, we can leave stringref in, instead of lowering it down, resulting in more efficient interoperation with the host Guile than if we had to bounce through byte arrays.

So, we wait for now. Not such a bad situation, at least we have GC coming soon to all the browsers. appy hacking to all my stringfolk, and until next time!

Andy Wingohttps://wingolog.org/just-in-time code generation within webassemblyhttps://wingolog.org/2022/08/18/just-in-time-code-generation-within-webassembly2022-08-18T15:36:53Z2022-08-18T15:36:53Z

Just-in-time (JIT) code generation is an important tactic when implementing a programming language. Generating code at run-time allows a program to specialize itself against the specific data it is run against. For a program that implements a programming language, that specialization is with respect to the program being run, and possibly with respect to the data that program uses.

The way this typically works is that the program generates bytes for the instruction set of the machine it's running on, and then transfers control to those instructions.

Usually the program has to put its generated code in memory that is specially marked as executable. However, this capability is missing in WebAssembly. How, then, to do just-in-time compilation in WebAssembly?

webassembly as a harvard architecture

In a von Neumman machine, like the ones that you are probably reading this on, code and data share an address space. There's only one kind of pointer, and it can point to anything: the bytes that implement the sin function, the number 42, the characters in "biscuits", or anything at all. WebAssembly is different in that its code is not addressable at run-time. Functions in a WebAssembly module are numbered sequentially from 0, and the WebAssembly call instruction takes the callee as an immediate parameter.

So, to add code to a WebAssembly program, somehow you'd have to augment the program with more functions. Let's assume we will make that possible somehow -- that your WebAssembly module that had N functions will now have N+1 functions, and with function N being the new one your program generated. How would we call it? Given that the call instructions hard-code the callee, the existing functions 0 to N-1 won't call it.

Here the answer is call_indirect. A bit of a reminder, this instruction take the callee as an operand, not an immediate parameter, allowing it to choose the callee function at run-time. The callee operand is an index into a table of functions. Conventionally, table 0 is called the indirect function table as it contains an entry for each function which might ever be the target of an indirect call.

With this in mind, our problem has two parts, then: (1) how to augment a WebAssembly module with a new function, and (2) how to get the original module to call the new code.

late linking of auxiliary webassembly modules

The key idea here is that to add code, the main program should generate a new WebAssembly module containing that code. Then we run a linking phase to actually bring that new code to life and make it available.

System linkers like ld typically require a complete set of symbols and relocations to resolve inter-archive references. However when performing a late link of JIT-generated code, we can take a short-cut: the main program can embed memory addresses directly into the code it generates. Therefore the generated module would import memory from the main module. All references from the generated code to the main module can be directly embedded in this way.

The generated module would also import the indirect function table from the main module. (We would ensure that the main module exports its memory and indirect function table via the toolchain.) When the main module makes the generated module, it also embeds a special patch function in the generated module. This function would add the new functions to the main module's indirect function table, and perform any relocations onto the main module's memory. All references from the main module to generated functions are installed via the patch function.

We plan on two implementations of late linking, but both share the fundamental mechanism of a generated WebAssembly module with a patch function.

dynamic linking via the run-time

One implementation of a linker is for the main module to cause the run-time to dynamically instantiate a new WebAssembly module. The run-time would provide the memory and indirect function table from the main module as imports when instantiating the generated module.

The advantage of dynamic linking is that it can update a live WebAssembly module without any need for re-instantiation or special run-time checkpointing support.

In the context of the web, JIT compilation can be triggered by the WebAssembly module in question, by calling out to functionality from JavaScript, or we can use a "pull-based" model to allow the JavaScript host to poll the WebAssembly instance for any pending JIT code.

For WASI deployments, you need a capability from the host. Either you import a module that provides run-time JIT capability, or you rely on the host to poll you for data.

static linking via wizer

Another idea is to build on Wizer's ability to take a snapshot of a WebAssembly module. You could extend Wizer to also be able to augment a module with new code. In this role, Wizer is effectively a late linker, linking in a new archive to an existing object.

Wizer already needs the ability to instantiate a WebAssembly module and to run its code. Causing Wizer to ask the module if it has any generated auxiliary module that should be instantiated, patched, and incorporated into the main module should not be a huge deal. Wizer can already run the patch function, to perform relocations to patch in access to the new functions. After having done that, Wizer (or some other tool) would need to snapshot the module, as usual, but also adding in the extra code.

As a technical detail, in the simplest case in which code is generated in units of functions which don't directly call each other, this is as simple as just appending the functions to the code section and then and appending the generated element segments to the main module's element segment, updating the appended function references to their new values by adding the total number of functions in the module before the new module was concatenated to each function reference.

late linking appears to be async codegen

From the perspective of a main program, WebAssembly JIT code generation via late linking appears the same as aynchronous code generation.

For example, take the C program:

struct Value;
struct Func {
  struct Expr *body;
  void *jitCode;
};

void recordJitCandidate(struct Func *func);
uint8_t* flushJitCode(); // Call to actually generate JIT code.

struct Value* interpretCall(struct Expr *body,
                            struct Value *arg);

struct Value* call(struct Func *func,
                   struct Value* val) {
  if (func->jitCode) {
    struct Value* (*f)(struct Value*) = jitCode;
    return f(val);
  } else {
    recordJitCandidate(func);
    return interpretCall(func->body, val);
  }
}

Here the C program allows for the possibility of JIT code generation: there is a slot in a Func instance to fill in with a code pointer. If this program generates code for a given Func, it won't be able to fill in the pointer -- it can't add new code to the image. But, it could tell Wizer to do so, and Wizer could snapshot the program, link in the new function, and patch &func->jitCode. From the program's perspective, it's as if the code becomes available asynchronously.

demo!

So many words, right? Let's see some code! As a sketch for other JIT compiler work, I implemented a little Scheme interpreter and JIT compiler, targetting WebAssembly. See interp.cc for the source. You compile it like this:

$ /opt/wasi-sdk/bin/clang++ -O2 -Wall \
   -mexec-model=reactor \
   -Wl,--growable-table \
   -Wl,--export-table \
   -DLIBRARY=1 \
   -fno-exceptions \
   interp.cc -o interplib.wasm

Here we are compiling with WASI SDK. I have version 14.

The -mexec-model=reactor argument means that this WASI module isn't just a run-once thing, after which its state is torn down; rather it's a multiple-entry component.

The two -Wl, options tell the linker to export the indirect function table, and to allow the indirect function table to be augmented by the JIT module.

The -DLIBRARY=1 is used by interp.cc; you can actually run and debug it natively but that's just for development. We're instead compiling to wasm and running with a WASI environment, giving us fprintf and other debugging niceties.

The -fno-exceptions is because WASI doesn't support exceptions currently. Also we don't need them.

WASI is mainly for non-browser use cases, but this module does so little that it doesn't need much from WASI and I can just polyfill it in browser JavaScript. So that's what we have here:

loading wasm-jit...

Each time you enter a Scheme expression, it will be parsed to an internal tree-like intermediate language. You can then run a recursive interpreter over that tree by pressing the "Evaluate" button. Press it a number of times, you should get the same result.

As the interpreter runs, it records any closures that it created. The Func instances attached to the closures have a slot for a C++ function pointer, which is initially NULL. Function pointers in WebAssembly are indexes into the indirect function table; the first slot is kept empty so that calling a NULL pointer (a pointer with value 0) causes an error. If the interpreter gets to a closure call and the closure's function's JIT code pointer is NULL, it will interpret the closure's body. Otherwise it will call the function pointer.

If you then press the "JIT" button above, the module will assemble a fresh WebAssembly module containing JIT code for the closures that it saw at run-time. Obviously that's just one heuristic: you could be more eager or more lazy; this is just a detail.

Although the particular JIT compiler isn't much of interest---the point being to see JIT code generation at all---it's nice to see that the fibonacci example sees a good speedup; try it yourself, and try it on different browsers if you can. Neat stuff!

not just the web

I was wondering how to get something like this working in a non-webby environment and it turns out that the Python interface to wasmtime is just the thing. I wrote a little interp.py harness that can do the same thing that we can do on the web; just run as `python3 interp.py`, after having `pip3 install wasmtime`:

$ python3 interp.py
...
Calling eval(0x11eb0) 5 times took 1.716s.
Calling jitModule()
jitModule result: <wasmtime._module.Module object at 0x7f2bef0821c0>
Instantiating and patching in JIT module
... 
Calling eval(0x11eb0) 5 times took 1.161s.

Interestingly it would appear that the performance of wasmtime's code (0.232s/invocation) is somewhat better than both SpiderMonkey (0.392s) and V8 (0.729s).

reflections

This work is just a proof of concept, but it's a step in a particular direction. As part of previous work with Fastly, we enabled the SpiderMonkey JavaScript engine to run on top of WebAssembly. When combined with pre-initialization via Wizer, you end up with a system that can start in microseconds: fast enough to instantiate a fresh, shared-nothing module on every HTTP request, for example.

The SpiderMonkey-on-WASI work left out JIT compilation, though, because, you know, WebAssembly doesn't support JIT compilation. JavaScript code actually ran via the C++ bytecode interpreter. But as we just found out, actually you can compile the bytecode: just-in-time, but at a different time-scale. What if you took a SpiderMonkey interpreter, pre-generated WebAssembly code for a user's JavaScript file, and then combined them into a single freeze-dried WebAssembly module via Wizer? You get the benefits of fast startup while also getting decent baseline performance. There are many engineering considerations here, but as part of work sponsored by Shopify, we have made good progress in this regard; details in another missive.

I think a kind of "offline JIT" has a lot of value for deployment environments like Shopify's and Fastly's, and you don't have to limit yourself to "total" optimizations: you can still collect and incorporate type feedback, and you get the benefit of taking advantage of adaptive optimization without having to actually run the JIT compiler at run-time.

But if we think of more traditional "online JIT" use cases, it's clear that relying on host JIT capabilities, while a good MVP, is not optimal. For one, you would like to be able to freely emit direct calls from generated code to existing code, instead of having to call indirectly or via imports. I think it still might make sense to have a language run-time express its generated code in the form of a WebAssembly module, though really you might want native support for compiling that code (asynchronously) from within WebAssembly itself, without calling out to a run-time. Most people I have talked to that work on WebAssembly implementations in JS engines believe that a JIT proposal will come some day, but it's good to know that we don't have to wait for it to start generating code and taking advantage of it.

& out

If you want to play around with the demo, do take a look at the wasm-jit Github project; it's fun stuff. Happy hacking, and until next time!

Andy Wingohttps://wingolog.org/unexpected concurrencyhttps://wingolog.org/2012/02/16/unexpected-concurrency2012-02-16T22:12:33Z2012-02-16T22:12:33Z

OK kids, quiz time. Spot the bugs in this Python class:

import os

class FD:
    _all_fds = set()

    def __init__(self, fd):
        self.fd = fd
        self._all_fds.add(fd)

    def close(self):
        if (self.fd):
            os.close(self.fd)
            self._all_fds.remove(self.fd)
            self.fd = None

    @classmethod
    def for_each_fd(self, proc):
        for fd in self._all_fds:
            proc(fd)

    def __del__(self):
        self.close()

The intention is pretty clear: you have a limited resource (file descriptors, in this case). You would like to make sure they get closed, no matter what happens in your program, so you wrap them in objects known to the garbage collector, and attach finalizers that close the descriptors. You have a for_each_fd procedure that should at least allow you to close all file descriptors, for example when your program is about to exec another program.

So, bugs?

* * *

Let's start with one: FD._all_fds can't sensibly be accessed from multiple threads at the same time. The file descriptors in the set are logically owned by particular pieces of code, and those pieces of code could be closing them while you're trying to for_each_fd on them.

Well, OK. Let's restrict the problem, then. Let's say there's only one thread. Next bug?

* * *

Another bug is that signals cause arbitrary code to run, at arbitrary points in your program. For example, if in the close method, you get a SIGINT after the os.close but before removing the file descriptor from the set, causing an exception to be thrown, you will be left with a closed descriptor in the set. If you swap the operations, you leak an fd. Neither situation is good.

The root cause of the problem here is that asynchronous signals introduce concurrency. Signal handlers are run in another logical thread of execution in your program -- even if they happen to share the same stack (as they do in CPython).

OK, let's mask out signals then. (This is starting to get ugly). What next?

* * *

What happens if, during for_each_fd, one of the FD objects becomes unreachable?

The Python language does not guarantee anything about when finalizers (__del__ methods) get called. (Indeed, it doesn't guarantee that they get called at all.) The CPython implementation will immediately finalize objects whose refcount equals zero. Running a finalizer on the method will mutate FD._all_fds, while it is being traversed, in this case.

The implications of this particular bug are either that CPython will throw an exception when it sees that the set was modified while iterating over it, or that the finalizer happens to close the fd being processed. Neither one of these cases are very nice, either.

This is the bug I wanted to get to with this article. Like asynchronous signals, finalizers introduce concurrency: even in languages with primitive threading models like Python.

Incidentally, this behavior of running finalizers from the main thread was an early bug in common Java implementations, 15 years ago. All JVM implementors have since fixed this, in the same way: running finalizers within a dedicated thread. This avoids the opportunity for deadlock, or for seeing inconsistent state. Guile will probably do this in 2.2.

For a more thorough discussion of this problem, Hans Boehm has published a number of papers on this topic. The 2002 Destructors, Finalizers, and Synchronization paper is a good one.

Andy Wingohttps://wingolog.org/object closure and the negative specificationhttps://wingolog.org/2008/04/22/object-closure-and-the-negative-specification2008-04-22T21:58:58Z2008-04-22T21:58:58Z

Guile-GNOME was the first object-oriented framework that I had ever worked with in Scheme. I came to it with all kinds of bogus ideas, mostly inherited from my C to Python formational trajectory. I'd like to discuss one of those today: the object closure. That is, if an object is code bound up with data, how does the code have access to data?

In C++, object closure is a non-problem. If you have an object, w, and you want to access some data associated with it, you dereference the widget structure to reach the member that you need:

char *str = w->name;

Since the compiler knows the type of w, it knows the exact layout of the memory pointed to by w. The ->name dereference compiles into a memory fetch from a fixed offset from the widget pointer.

In constrast, data access in Python is computationally expensive. A simple expression like w.name must perform the following steps:

  1. look up the class of w (call it W)

  2. loop through all of the classes in W's "method resolution order" --- an ordered set of all of W's superclasses --- to see if the class defines a "descriptor" for this property. In some cases, this descriptor might be called to get the value for name.

  3. find the "dictionary", a hash table, associated with w. If the dictionary contains a value for name, return that.

  4. otherwise if there was a descriptor, call the descriptor to see what to do.

This process is run every time you see a . between two letters in python. OK, so getattr does have an opcode to itself in CPython's VM instruction set, and the above code is implemented mostly in C (see Objects/object.c:PyObject_GenericGetAttr). But that's about as fast as it can possibly get, because the structure of the Python language definition prohibits any implementation of Python from ever having enough information to implement the direct memory access that is possible in C++.

But, you claim, that's just what you get when you program in a dynamic language! What do you want to do, go back to C++?

straw man says nay

"First, do no harm", said a practitioner of another profession. Fundamental data structures should be chosen in such a way that needed optimizations are possible. Constructs such as Python's namespaces-as-dicts actively work against important optimizations, effectively putting an upper bound on how fast code can run.

So for example in the case of the object closure, if we are to permit direct memory access, we should allow data to be allocated at a fixed offset into the object's memory area.

Then, the basic language constructs that associate names with values should be provided in such a way that the compiler can determine what the offset is for each data element.

In dynamic languages, types and methods are defined and redefined at runtime. New object layouts come into being, and methods which operated on layouts of one type will see objects of new types as the program evolves. All of this means that to maintain this direct-access characteristic, the compiler must be present at runtime as well.

So, in my silly w.name example, there are two cases: one, in which the getattr method is seeing the combination of the class W and the slot name for the first time, and one in which we have seen this combination already. In the first case, the compiler runs, associating this particular combination of types with a new procedure, newly compiled to perform the direct access corresponding to where the name slot is allocated in instances of type W. Once this association is established, or looked up as in the second case, we jump into the compiled access procedure.

Note that at this point, we haven't specified what the relationship is between layouts and subclassing. We could further specify that subclasses cannot alter the layout of slots defined by superclasses. Or, we could just leave it as it is, which is what Guile does.

Guile, you say? That slow, interpreted Scheme implementation? Well yes, I recently realized (read: was told) that Guile in fact implements this exact algorithm for dispatching its generic functions. Slot access does indeed compile down to direct access, as far as can be done in a semi-interpreted Scheme, anyway. The equivalent of the __mro__ traversal mentioned in the above description of python's getattr, which would be performed by slot-ref, is compiled out in Guile's slot accessor generics.

In fact, as a theoretical aside, since Guile dispatches lazily on the exact types of the arguments given to generic functions (and not just the specializer types declared on the individual methods), it can lazily compile methods knowing exactly what types they are operating on, with all the possiblities for direct access and avoidance of typechecking that that entails. But this optimization has not yet entered the realm of practice.

words on concision

Python did get one thing right, however: objects' code access their data via a single character.

It is generally true that we tend to believe that the expense of a programming construct is proportional to the amount of writer's cramp that it causes us (by "belief" I mean here an unconscious tendency rather than a fervent conviction). Indeed, this is not a bad psychological principle for language designers to keep in mind. We think of addition as cheap partly because we can notate it with a single character: "+". Even if we believe that a construct is expensive, we will often prefer it to a cheaper one if it will cut our writing effort in half.

Guy Steele, Debunking the 'Expensive Procedure Call' Myth, or, Procedure Call Implementations Considered Harmful, or, Lambda: The Ultimate GOTO (p.9)

Since starting with Guile, over 5 years ago now, I've struggled a lot with object-oriented notation. The problem has been to achieve that kind of Python-like concision while maintaining schemeliness. I started with the procedural slot access procedures:

(slot-ref w 'name)
(slot-set! w 'name "newname")

But these procedures are ugly and verbose. Besides that, since they are not implemented as generic functions, they prevent the lazy compilation mentioned above.

GOOPS, Guile's object system, does allow you to define slot accessor generic functions. So when you define the class, you pass the #:accessor keyword inside the slot definition:

(define-class <foo> ()
  (bar #:init-keyword #:bar #:accessor bar))

(define x (make <foo> #:bar 3))
(bar x) => 3
(set! (bar x) 4)

Now for me, typographically, this is pretty good. In addition, it's compilable, as mentioned above, and it's mappable: one can (map bar list-of-x), which compares favorably to the Python equivalent, [x.name for x in list_of_x].

My problem with this solution, however, is its interaction with namespaces and modules. Suppose that your module provides the type, <foo>, or, more to the point, <gtk-window>. If <gtk-window> has 54 slots, and you define accessors for all of those slots, you have to export 54 more symbols as part of your module's interface.

This heavy "namespace footprint" is partly psychological, and partly real.

It is "only" psychological inasmuch as methods of generic functions do not "occupy" a whole name; they only specify what happens when a procedure is called with particular types of arguments. Thus, if opacity is an accessor, it doesn't occlude other procedures named opacity, it just specifies what happens when you call (opacity x) for certain types of x. It does conflict with other types of interface exports however (variables, classes, ...), although classes have their own <typographic-convention>. *Global-variables* do as well, and other kinds of exports are not common. So in theory the footprint is small.

On the other hand, there are real impacts to reading code written in this style. You read the code and think, "where does bar come from?" This mental computation is accompanied with machine computation. First, because in a Scheme like Guile that starts from scratch every time it's run, the accessor procedures have to be allocated and initialized every time the program runs. (The alternatives would be an emacs-like dump procedure, or R6RS-like separate module compilation.) Second, because the (drastically) increased number of names in the global namespace slows down name resolution.

lexical accessors

Recently, I came upon a compromise solution that works well for me: the with-accessors macro. For example, to scale the opacity of a window by a ratio, you could do it like this:

(define (scale-opacity w ratio)
  (with-accessors (opacity)
    (set! (opacity w)
          (* (opacity w) ratio))))

This way you have all of the benefits of accessors, with the added benefit that you (and the compiler) can see lexically where the opacity binding comes from.

Well, almost all of the benefits, anyway: for various reasons, for this construct to be implemented with accessors, Guile would need to support subclasses of generic functions, which is does not yet. But the user-level code is correct.

Note that opacity works on instances of any type that has an opacity slot, not just windows.

Also note that the fact that we allow slots to be allocated in the object's memory area does not prohibit other slot allocations. In the case of <gtk-window>, the getters and setters for the opacity slot actually manipulate the opacity GObject property. As you would expect, no memory is allocated for the slot in the Scheme wrapper.

For posterity, here is a defmacro-style definition of with-accessors, for Guile:

(define-macro (with-accessors names . body)
  `(let (,@(map (lambda (name)
                  `(,name ,(make-procedure-with-setter
                            (lambda (x) (slot-ref x name))
                            (lambda (x y) (slot-set! x name y)))))
                names))
     ,@body))

final notes

Interacting with a system with a meta-object protocol has been a real eye-opener for me. Especially interesting has been the interplay between the specification, which specifies the affordances of the object system, and the largely unwritten "negative specification", which is the set of optimizations that the specification hopes to preserve. Interested readers may want to check out Gregor Kiczales' work on meta-object protocols, the canonical work being his "The Art of the Metaobject Protocol". All of Kiczales' work is beautiful, except the aspect-oriented programming stuff.

For completeness, I should mention the java-dot notation, which has been adopted by a number of lispy languages targetting the JVM or the CLR. Although I guess it meshes well with the underlying library systems, I find it to be ugly and non-Schemey.

And regarding Python, lest I be accused of ignoring __slots__: the getattr lookup process described is the same, even if your class defines __slots__. The __slots__ case is handled by descriptors in step 2. This is specified in the language definition. If slots were not implemented using descriptors, then you would still have to do the search to see if there were descriptors, although some version of the lazy compilation technique could apply.

Andy Wingohttps://wingolog.org/eeeevilhttps://wingolog.org/2007/11/28/eeeevil2007-11-28T20:25:27Z2007-11-28T20:25:27Z

Just now, I wanted to define the all function in Python, which takes a sequence as its argument and returns True iff no element of the sequence is False. My instinct was to do it with reduce:

all = lambda seq: reduce(and, seq, True)

But and is a syntactic keyword, so that doesn't work. However, abusing the fact that Python follows Iverson's convention, we can map int.__mul__ instead:

all = lambda seq: reduce(int.__mul__, seq, True)

Evil, delicious evil. Do check out David Jones' weblog if you haven't already, it's really interesting. I started reading it the other day and couldn't stop :)

Andy Wingohttps://wingolog.org/reducing the footprint of python applicationshttps://wingolog.org/2007/11/27/reducing-the-footprint-of-python-applications2007-11-27T18:08:08Z2007-11-27T18:08:08Z

Last week I was making up notes for today's forthcoming Flumotion 0.5.1 release, which is exciting stuff. We have reduced Flumotion's memory footprint considerably. However, while attempting to quantify this, I noted that the writable memory usage of our manager process actually increased. Unacceptable!

what is my memory footprint?

Optimization must start with accurate benchmarks, to know how much you are improving things (or not), and to know when you can stop. The best commonly-deployed measurement available on Linux systems is the /proc/*/smaps data.

When developing an application that integrates with the rest of your system, the important statistic to get is the amount of writable memory. Writable memory is necessarily local to your process, representing an amount of data that "occupies space" on your system.

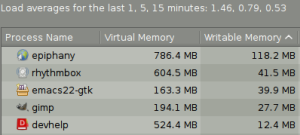
Fortunately, this information is available in Gnome's sytem monitor, System > Administration > System Monitor on my machine. If you don't see a "Writable memory" column, edit your preferences to include it. You can also get the raw smaps information if you right-click on the process in question.

Alternately, from the command line, Maurer's smem.pl script can also summarize the smaps info into a human-readable format, but it requires an external perl module. I found it easier and more entertaining to write my own smaps parser, mem_usage.py, which may be invoked as mem_usage.py PID, assuming that you have the privileges to read that process' smaps file. For example:

wingo@videoscale:~/f/flumotion$ mem_usage.py 9618
Mapped memory:
               Shared            Private
           Clean    Dirty    Clean    Dirty
    r-xp    3396        0      500        0  -- Code
    rw-p      36        0        8      656  -- Data
    r--p      16        0        0       12  -- Read-only data
    ---p       0        0        0        0
    r--s      12        0        0        0
   total    3460        0      508      668
Anonymous memory:
               Shared            Private
           Clean    Dirty    Clean    Dirty
    r-xp       0        0        0        0
    rw-p       0        0        0    19020  -- Data (malloc, mmap)
   total       0        0        0    19020
   ----------------------------------------
   total    3460        0      508    19688

In this example (run on flumotion-manager from 0.4.2), we see that the process occupies 19.6 MiB of writable memory, the number in the bottom right of the output.

$ FLU_DEBUG=4 /usr/bin/time \
  bin/flumotion-manager conf/managers/default/planet.xml
0.84user 0.21system 0:02.22elapsed 47%CPU (0avgtext+0avgdata 0maxresident)k
0inputs+0outputs (0major+6472minor)pagefaults 0swaps

Another useful, widely deployed tool is GNU's time, which is different from the bash builtin. The number of page faults, while not a stable number, can give a general idea of your application's VM footprint. See section 7.1 of Drepper's memory paper for more information on these numbers.

plugging memory leaks

Once your footprint is known, you can start to take a look at what is actually using memory. With Python this presents a challenge in that most tools are designed to debug C and not Python programs -- they analyze the C stack, the libc allocator, etc. We have a few options at our disposal, though.

PySizer works well for me in answering the question, "what objects are allocated in Python, and how much memory do they take". PySizer provides low-level tools for fondling python's heap, with a pretty good tutorial, check it out. Version 0.1.1 has worked for me. I have found that with my unpatched Python 2.5 that the simplegroupby results are not entirely accurate, however.

To me, PySizer is more useful when investigating memory leaks than when doing static memory profiles. In addition to being able to annotate objects with their referents and referrers, you can take a diff beteen two scan operations, allowing you to see where objects were actually leaked.

Another option to consider is Heapy, which looks better than PySizer, but it segfaults for me. Probably an x86-64-related problem.

People writing applications with Twisted might be interested in Flumotion's AllocMonitor, which bundles up this functionality into a poller that periodically prints out newly allocated objects. Running a full scan of the heap is relatively expensive, so it's not something you'd want to run in production, but it has proved useful to me.

One nice leak that I found a while back was a reference cycle involving an object with a __del__ method. Turns out, Python's garbage collector doesn't free these at all (search for __del__ on the docs for the gc module). Trouble is, it doesn't warn you about this either, leading to a silent leak. The UncollectableMonitor polls gc.garbage every couple minutes, printing out some nasty warnings if it finds uncollectable garbage. Nasty, but worth running in production.

So what happens when your boss tells you that some critical process has 455 MB of resident memory, and asks you to figure out what's going on? Obviously taking up that much memory is not without its performance problems. The question is the same, though: what's taking up all that memory? How long is that list, anyway?

In this case I've found it invaluable to be able to get a Python prompt on a running, daemonized process via Twisted's horrendously underdocumented manhole code. You might find the wrapper I wrote to be easier to use. The flumotion manhole module exports functions to open a manhole either over ssh (authenticating against some authorized keys file, e.g. ~/.ssh/authorized_keys) or over telnet (no authentication), to which you can ssh or telnet to from a terminal.

Manhole is pretty neat. It offers an interactive command-prompt that integrates with the reactor, so that your daemon keeps on doing its thing while you're typing in expressions. Its support for line editing is rudimentary, but it works pretty well, and has helped me to plug a number of leaks in Flumotion, allowing me to poke around in the program's state and run the AllocMonitor if needed.

what's taking all that memory?

Tackling the steady-state memory footprint of a python daemon is more of a black art. I have no general techniques here. However, I would like to mention how we reduced memory use in a number of cases.

One big improvement that we made was to remove unnecessary libraries from long-running processes. You can see what libraries are loaded into an application via looking at gnome-system-monitor's smaps information, and sorting in descending order of private dirty memory. Each library loaded takes at least a page of memory for the jump tables, and in some cases quite a bit more for library-private data. For example, Maurer notes, "[a]n extreme example of this is libaudiofile. This library has 92 kb of dirty, private rss (isn't that naughty!)."

Odd to find, then, that our Gtk+ administration program loads libaudiofile, when we didn't even use it! It turns out that this came from a line in our Glade XML files, <requires lib="gnome"/>. This little line caused libglade to load up libgnomeui, which then pulls in lots of unnecessary things. I removed those lines with no effect at all, we weren't even using the deprecated libgnomeui widgets.

Another big win is a bit painful to mention, as an erstwhile GStreamer hacker. Loading GStreamer takes up quite a bit of memory. The amount of writable memory that it takes up appears to depend on the size of your registry, and of course the whether you have a 32-bit or a 64-bit userspace. On one of our 32-bit production servers, "import gst" causes a simple python listener's writable memory usage to increase by 1.3MB. On my 64-bit desktop with more plugins installed, more than 5 MB extra is consumed!

There are two ways to look at this problem. One of them is to make a binary, mmap(2)able registry, which will put the information from the registry into a read-only memory segment. The other obvious solution is to remove GStreamer from processes that don't need it, which in Flumotion is every process that does not directly process sound or video data. In one process, we even introduced a fork so that the a short-running function that needs GStreamer would not impact the memory footprint of the long-running process.

Note that not all libraries are as heavy as this, though. For example, "import gobject" only causes a 200 kB increase on my 64-bit system. In fact, in an effort to remove gobject from some processes, I think that I actually increased writable memory usage, via forcing the use of python's optparse and not gobject's GOption code.

Not coincidentally, Flumotion has a registry as well, modeled after GStreamer's. It suffers from the same problems, but more acutely. I knew this intuitively, and so removed registry parsing from all processes but the manager, but it wasn't until I ran Valgrind's Massif on the manager that I knew the extent of the problem.

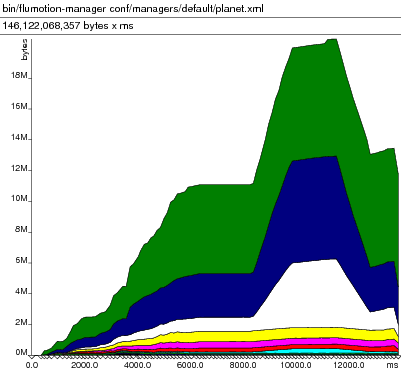
The above image shows memory allocation within flumotion's manager process over time, at startup. The problem with Massif and Python, of course, is that it shows you an inappropriate level of detail. It would be nice to be able to annotate the interaction between the program and Massif so that you could, for example, show on the graph when individual modules are loaded.

Barring that, I started up the manager under strace, along with verbose Flumotion logging and python logging, which shows me when modules are loaded.

The first thing that I saw was lots of open() calls and read() calls on all of the source files in the flumotion tree, which turned out to be an embarrassing bug in which we were actually computing an md5sum for all flumotion source files at startup. Yikes! While not really a memory problem, that was killing our startup performance. Fixed that, and a couple of other filesystem use inefficiencies.

Then next thing that I saw was our real problem:

open("/home/wingo/f/flumotion/cache/registry/registry.xml", O_RDONLY) = 3
fstat(3, {st_mode=S_IFREG|0644, st_size=116402, ...}) = 0
mmap(NULL, 4096, PROT_READ|PROT_WRITE, MAP_PRIVATE|MAP_ANONYMOUS, -1, 0) = 0x2ae8fac27000
read(3, "\n\n  \n\n    "..., 16384) = 16384
brk(0x1137000)                          = 0x1137000
brk(0x118b000)                          = 0x118b000
brk(0x11ac000)                          = 0x11ac000
brk(0x11cd000)                          = 0x11cd000
brk(0x11ee000)                          = 0x11ee000
...
brk(0x1a2e000)                          = 0x1a2e000
brk(0x1a86000)                          = 0x1a86000
brk(0x1ac6000)                          = 0x1ac6000

It was reading and parsing our registry file that was causing that enormous memory spike in the image. (brk is a low-level system call that allocates more heap for a process, and is often used in malloc implementations.) Simple subtraction from the last segment position to the first yields almost 10 MB allocated while reading a 116 kB XML file. Ouch!

What's worse, that memory was never given back to the system, despite the recent work on the python memory allocator -- there were no subsequent munmap(2) calls, and the segment was never moved back. So that usage spike that valgrind showed us had longer-lasting effects: writable memory usage of that process never dropped below its maximum. Presumably this was because the heap was left in an extremely fragmented state, with the live objects spread over many pages, so that no page could be returned to the OS.

As is the case with GStreamer, Flumotion's registry is just a cache, though; logically a union of the information available in many small files spread through the Flumotion tree. It is recalculated as necessary. As a temporary solution to this problem, I made Flumotion not look for this cache, instead traversing the tree and reconstructing the registry via the parsing of these many small files. This leads to a sawtooth memory use pattern, rather than the "big spike" from above, leaving the heap more compact and less fragmented. This strategy has real effects, saving 7 or 8 MB of writable memory on my machine.

The downside of course is that with a cold cache, you cause many disk seeks as the directories are traversed and all of the file snippets are read. The real solution would be to make some kind of registry cache format that does not impose an 80-times memory penalty as XML DOM parsing does. However, in our case with 100+ managers running on one server, the memory benefits are key, and the registry snippets will likely be loaded from disk cache anyway.

Note that in trunk Valgrind, Massif has been completely rewritten, and doesn't appear to do graphs yet. I used the 3.2.3 version that is packaged on my Debian-derived distro, which worked well. The massif graph was interesting for one thing: it shows that 5 MB are allocated via CRYPTO_malloc, so I tried running Flumotion without SSL. Indeed, writable memory usage is 5 MB lower. Probably more low-hanging fruit there.

lessons

  • pysizer is useful for detecting what objects are being leaked

  • avoid __del__ and reference cycles, and monitor gc.garbage

  • strace tells you what crack things you're doing

  • massif interesting, but misleading as to your total footprint

  • writable memory numbers are the most important

  • CPython's memory footprint is terrible; not only is all code stored in private dirty memory, all code and data that is used is written to when twiddling refcounts

  • 64-bit python processes use about twice the memory as 32-bit

  • reducing number of linked libraries often helps, but not always

Finally, I'd like to show the output of mem_usage.py on flumotion-manager from trunk:

wingo@videoscale:~/f/flumotion$ mem_usage.py 10784
Mapped memory:
               Shared            Private
           Clean    Dirty    Clean    Dirty
    r-xp    2748        0      508        0  -- Code
    rw-p      36        0        8      608  -- Data
    r--p      16        0        0       12  -- Read-only data
    ---p       0        0        0        0
    r--s      12        0        0        0
   total    2812        0      516      620
Anonymous memory:
               Shared            Private
           Clean    Dirty    Clean    Dirty
    r-xp       0        0        0        0
    rw-p       0        0        0    12800  -- Data (malloc, mmap)
   total       0        0        0    12800
   ----------------------------------------
   total    2812        0      516    13420
$ FLU_DEBUG=4 /usr/bin/time \
  bin/flumotion-manager conf/managers/default/planet.xml
0.80user 0.04system 0:01.84elapsed 45%CPU (0avgtext+0avgdata 0maxresident)k
0inputs+0outputs (0major+4596minor)pagefaults 0swaps

Dropped 6 MiB and 2000 page faults from the manager, not bad at all!

Andy Wingohttps://wingolog.org/slimehttps://wingolog.org/2006/01/02/slime2006-01-02T23:12:10Z2006-01-02T23:12:10Z

I've been meaning to try out SLIME for a long time, and finally got around to it a couple of months ago. Let me say that I'm very, very impressed with the rich development environment Common Lisp people have made for themselves. The python environment I use at work (Emacs for editing, ipython for experimenting, occasional usage of grep) pales in comparison.

I told myself then that I'd have to write down what it is that makes SLIME so great, but that got put aside in the runup to GStreamer 0.10. Now with a bit more time on my hands I've taken another look at it. It's still impressive.

Implementation notes

I have to touch on the implementation first, because otherwise the rest won't make sense. Most emacs and vi users are accustomed to specialized editor modes for different languages: one for python to help in indentation, one for C, etc. These modes rely on textual, syntactic analysis of the source code file to try to anticipate what you want the editor to do. However it's never perfect; local variables that have the same name as builtin functions in python still get highlighted as if they were builtins, some macros might upset the indenter in C, etc.

SLIME takes a different approach to "editor modes". It's a client-server architecture; the Emacs part of SLIME connects to an external Lisp process, which is running a SLIME server. The two sides communicate via a special RPC protocol.

If SLIME existed for Python, it would not highlight builtins based on their name. Instead it would have an inferior python interpreter running the whole time, and when the user types in map, it would ask the python interpreter what map is. Based on that answer it would then choose how to highlight the word, and maybe even tell the programmer what the arguments to map are.

The server is written in mostly-portable Common Lisp, so that it runs on something like 9 implementation of the language. Because the protocol is the same, SLIME can interact with all implementations in the same way. This is of great interest to CL programmers, but even Python has a couple of other slightly incompatible implementations, so the idea of communicating via sockets with an external server is still a good one.

I'm going to artificially divide up SLIME's feature set into a few categories: writing new code, changing existing code, finding code, and debugging. To make the examples more relevant for most people, I'll make some speculations throughout about what these features would mean if they were implemented for Python.

Writing code

I've amazed my co-worker Thomas, a vi user, with the emacs command dabbrev-expand, normally bound to M-/. For example typing p r o g M-/ in this file expands prog out to programmers. However because this expansion is just textual, it often takes a few presses of the M-/ before I get the word I want. For example, when looking for a method, a module name will expand out, or a word from comments.

SLIME extends emacs such that M-TAB tries to expand the symbol at point (the cursor) to other symbols available in that package (module) in Lisp. If I type a p p M-TAB, SLIME tells me that the two symbols append and apply are available for me to use, and if there is only one possible completion it goes ahead and finishes the word.

In addition "fuzzy completion" is available as an option, such that norm-df could expand to least-positive-normalized-double-float. Neat eh? In Python this would be more usefully implemented to autocomplete attributes as well.

Once you have the function you want, moving to the arguments by pressing the space bar (SPC) will show the function's argument list in the minibuffer. For example typing ( a p p e n d SPC in a Lisp file or at the REPL (listener) will cause (append &rest lists) to show up in the minibuffer. This describes the kind of arguments that append can take.

For more complicated functions with lots of keyword arguments, it's sometimes better to have the form expand out into your source itself. This can be done with C-c C-s, the binding for slime-complete-form. For example, if you have this in your source:

  (find 17

and you press C-c C-s, it will expand out to:

  (find 17 sequence :from-end from-end :test test
        :test-not test-not :start start :end end :key key)

If you need full documentation on find, you can put the point over find and run slime-describe-function via C-c C-f, and you get full documentation on the routine displayed in another pane. The same can be done with other variables via slime-describe-symbol.

Thankfully, unlike C, there is one indentation custom agreed upon by most all Lisp programmers. The convention depends on the first element of an expression. SLIME makes sure that the editor knows how to indent properly by checking the type of the operator with the Lisp environment. (This is a pet peeve of mine when hacking Guile, that Emacs often doesn't know how to indent my macros.)

Changing code

Of course, programming in a dynamic language usually doesn't follow a strict write-compile-run-debug cycle. Normally, people try to make small pieces that work, and then put them together. SLIME offers a number of conveniences that decrease the distance between writing code and seeing what it does.

Common Lisp is a dynamic, compiled language. You can recompile just one function, and have a running program take up that new definition. In fact, because SLIME has a connection to your running program, there are hotkeys to do just that. Like compilers for other languages, Lisp compilers can issue warnings corresponding to particular pieces of code. These warnings then show up in your source files as being underlined. For example, after compiling a function, unused variables will become underlined, and if you hover the mouse over the variables, the text of the compiler warning will show up as a tooltip.

In the hypothetical SLIME for Python, you would expect that the same would be possible -- send over a new method implementation, monkeypatch the class, and then all instances will use that method (even existing instances). Also if pychecker is available, it can be run on that function to give you similar kinds of warning information that can be translated to tooltips in the source files. All this is possible without having to restart your program.

(As a parenthesis, Common Lisp's object system was designed to allow reloading class definitions, and lazily migrating existing instances over to the new layout. I don't think Python can do this yet, but I'm not sure.)

Finding code

Oftentimes a programmer decides to change some aspect of a program's behavior, but is unfamiliar with the code concerned. This happens especially often on multi-programmer projects. The search for the proper code to change usually takes more time than the change itself. SLIME offers a number of facilities to speed up the search.

The traditional way of cross-referencing source code is via the use of ctags/etags. First you set up some makefile rules for producing a TAGS file, which syntactically analyzes all of the source files in a project and notes the names and locations of all of the function definitions. Automake can assist with this. Then in your editor with the cursor on a function invocation, you press some key combination (M-. in emacs) and your editor takes you to the definition.

This method is useful, but also a pain. If there are multiple functions with the same name (particularly bad in object-oriented languages), it takes a while to find the right one. Then there's the fact that you have to set up your source to build TAGS files, and keep them up-to-date. Finally, at least in Emacs, using TAGS files from multiple project is a PITA.

SLIME instead offers a meta-point facility (named after the key combination, M-.) that asks Lisp where the function was defined. SLIME saves where you were so you can go back there later. The saved location list is a stack, so you can meta-point out more than one time, and when you pop back via M-, you'll be in the last place you pressed M-.. This eliminates the need for syntactical analysis via TAGS files, and removes the duplicate-name problem.

If the Lisp implementation supports it, SLIME can offer much more detailed cross-referencing information: where a function is called, where a variable is referenced, where a macro is expanded, and where a generic function is specialized (akin to implementing a virtual method). Python could offer this information as well, but you would have to run a function to walk all modules, examining functions' bytecode and building an index.

Finally, SLIME offers easy access to all of the interactive documentation that Lisp knows about: docstrings on functions, documentation properties on variables, and the hyperspec, a heavily cross-referenced language reference. A SLIME for Python would offer similar facilities.

Debugging

I hardly ever use the debugger in Python. Part of it is that the code I work on mostly involves asynchronous calls, which are tough to debug, but mostly it's that I always forget how to use it. There are many occasions on which a debugger would be useful but I can't be bothered to remember how to start it.

SLIME makes all this very easy. Whenever a condition (like an exception) is signaled, the debugger is brought up in a transient pane (emacs' equivalent of a dialog box). From there you get a nice backtrace, a description of the error, and a list of restarts. The normal case is to press q and the last available restart will be chosen, which for example in the REPL will abort the evaluation.

Simple backtraces are readily had from ipython however. SLIME goes significantly beyond this. Each frame in the backtrace can be expanded out to show all of the local variables in the frame. This is done by putting the cursor on the frame and pressing enter.

If you press enter on a local variable, you start up the inspector, which opens in another transient pane. The inspector is really neat. It tells you everything it knows about a value. For example, the number 3 is described as an integer, then is shown in many different bases and as a time value. Compound values like closures are decomposed into their constituents. From a closure you can get the function object, together with the local variables that the function closes over. The function object itself can be inspected to show the source info (where it came from), the native code that the function compiled to, the arguments, etc. The inspector keeps a stack of objects so you can dig down and come back up to where you were. I would kill to have this in Python.

It would be really useful to be able to open up such a debugger if an exception has to be trapped, for example if an error occurs in a function run from the GObject main loop. As it is, I have to deal with python printing a backtrace, and I don't even get to know which values were on the stack.

Of course, SLIME also supports the traditional debugger interface of breakpoints and single-stepping. There are hotkeys assigned to break on certain lines, and also to trace/untrace functions. Common Lisp specifies a statistical profiling interface, so that also can be enabled and disabled from within the editor. Some Lisp implementations can give profiling information for each instruction executed by the CPU.

Things I didn't know python-mode could do

Until writing this, I hadn't fully investigated python-mode. It doesn't exactly have a nice manual like SLIME does, nor have I seen exponents like I have from the Lisp community.

But, browsing the docstrings it appears that python-mode offers rudimentary support for dynamic programming. It can run python in a subshell, and send strings to that shell. Unfortunately the listener is unmodified from what python gives you: no highlighting, no indentation, nothing. The subshell doesn't even know it's python that it talks to; it just recognizes the >>> and ....

There is some support for the python debugger, pdb, but I'm not sure how to get to it. It just recognizes the strings that pdb outputs.

There is supporting for reloading modules as well, but again it's quite primitive. All in all python-mode appears to be a start at dynamic programming but it does not approach SLIME. (This is an opportunity, not a condemnation.)

Coda

I wrote this article for a couple of reasons. One was for myself, to make sure that I understood everything that SLIME does. Another was to raise awareness of the integration possibilities between editors and dynamic languages, in the hopes that in a couple years I won't be using the same environment I'm using now.

I'm particularly interested in Emacs integration with Scheme and Python. There does exist a port of SLIME to Scheme48. I suspect that for languages not in the Lisp family, a fork or a "port of ideas" would be the best that can be done.

Comments welcome via e-mail or trackback, especially regarding other ways of programming dynamic languages. wingo at pobox dot com.

Andy Wingohttps://wingolog.org/post-harvest moonhttps://wingolog.org/2005/11/13/post-harvest-moon2005-11-13T23:42:58Z2005-11-13T23:42:58Z

harvest time on maggie's farm

Finally got a Flumotion release out last week. Hounding us until the end was a terrible bug manifesting itself as random connection loss between the different processes in the server, and 100% CPU usage that couldn't be traced to anything. None of the profilers I tried (or wrote!) gave any clue as to what was up.

The problems were solved when we switched away from forking out job processes to doing fork+exec, which is a more supported model in Twisted. It could be that we weren't correctly cleaning out all of the file descriptors in the child's main loops implementing the reactor in Twisted, causing processes to wake up all the time. It is difficult to analyze exactly what is the state that needs cleaning up in a program like that, instead of analyzing exactly what state to keep for the new process. Also, exarkun in #twisted had an interesting observation, which was that with python's refcounting gc, just about every time you access a variable you modify its refcount, which requires that the child have its own copy of that memory page. Really takes away the copy-on-write advantages of forking processes.

The moral of the story would be that usually you don't want to fork in Python. Changing this to execute separate processes took about 4 hours one afternoon, and took away just about all of the bugs we had been seeing. Thank Jesus!

Also those four hours were krazy 4G1L3. Only thing was it was on my machine, and I have focus-follows-mouse, a different keyboard from Thomas, swapped caps and control, and I use emacs and he uses vi. But somehow we limped along. Agile limping.

very crucially serious notes

A perspicacious analysis of the advantages of being a nice person.

Also this is the crucial phrase of this sentence. I think this convention is so great I'm going find a professional typographer to ask what they think about it. It's about time that some of the popular exponents of this writing style get their well-deserved recognition!

Other things I should write about at some point: more notes on using baz and arch-pqm, my very pleasant impressions of SLIME and SBCL, a recent Aikido seminar with Miyamoto sensei (coming all the way from Hombu dojo), an upcoming trip to the states.

Andy Wingohttps://wingolog.org/Profilinghttps://wingolog.org/2005/10/28/profiling2005-10-28T15:53:19Z2005-10-28T15:53:19Z

Python

For some reason Flumotion is running at 100% cpu when starting components. It didn't use to do this, and it doesn't really make much sense -- the rate of data input is limited by the capture devices, and a certain time's worth of data has to accumulate to fill all of the relevant buffers in the encoders, muxers, and streamers.

But I have no clue where this CPU usage is. I tried pressing control-C occasionally and getting backtraces in GDB, but the normal methods aren't working.

In the end this was all due to not having an idea of where Flumotion spends its time. I wanted to profile, but didn't want to use an instrumenting profiler, and there didn't exist a sampling profiler for Python. So I ported the one I hacked on for Guile to python; it's available here.

Usage goes like this:

>>> import statprof
>>> statprof.start()
>>> import test.pystone; test.pystone.pystones()
(1.3200000000000001, 37878.78787878788)
>>> statprof.stop()
>>> statprof.display()
  %   cumulative      self          
 time    seconds   seconds  name    
 23.01      1.36      0.31  pystone.py:79:Proc0
 15.04      0.60      0.20  pystone.py:133:Proc1
 11.50      0.16      0.16  pystone.py:45:__init__
 10.62      0.14      0.14  pystone.py:208:Proc8
  7.96      0.16      0.11  pystone.py:229:Func2
  7.96      0.11      0.11  pystone.py:221:Func1
  6.19      0.12      0.08  pystone.py:160:Proc3
  5.31      0.07      0.07  pystone.py:203:Proc7
  3.54      0.20      0.05  pystone.py:53:copy
  2.65      0.05      0.04  pystone.py:184:Proc6
  2.65      0.04      0.04  pystone.py:149:Proc2
  1.77      0.02      0.02  pystone.py:170:Proc4
  0.88      0.01      0.01  pystone.py:177:Proc5
  0.88      0.01      0.01  pystone.py:246:Func3
  0.00      1.36      0.00  pystone.py:67:pystones
  0.00      1.36      0.00  <stdin>:1:?
---
Sample count: 113
Total time: 1.360000 seconds

There's lots of info in help(statprof). Also it requires the itimer extension from http://www.cute.fi/~torppa/py-itimer/. Just unpack the tarball and run sudo python setup.py install.

It's not very well tested at this point, but it gives similar results as the stock profiler (10-20 times faster though). It's of course not the same, because an instrumenting profiler unfairly penalizes procedure calls; while they do have a cost it is much less than their cost as measured by the stock profiler or hotshot.

I'd be interested in hearing about bugs in it for the next few weeks; after that it will probably slip from my mind though. (This is of course the natural fate of profilers, to bitrot. I have a larger rant about this for later.)