wingologA mostly dorky weblog by Andy Wingo2022-08-18T15:36:53Ztekutihttps://wingolog.org/feed/atomAndy Wingohttps://wingolog.org/just-in-time code generation within webassemblyhttps://wingolog.org/2022/08/18/just-in-time-code-generation-within-webassembly2022-08-18T15:36:53Z2022-08-18T15:36:53Z

Just-in-time (JIT) code generation is an important tactic when implementing a programming language. Generating code at run-time allows a program to specialize itself against the specific data it is run against. For a program that implements a programming language, that specialization is with respect to the program being run, and possibly with respect to the data that program uses.

The way this typically works is that the program generates bytes for the instruction set of the machine it's running on, and then transfers control to those instructions.

Usually the program has to put its generated code in memory that is specially marked as executable. However, this capability is missing in WebAssembly. How, then, to do just-in-time compilation in WebAssembly?

webassembly as a harvard architecture

In a von Neumman machine, like the ones that you are probably reading this on, code and data share an address space. There's only one kind of pointer, and it can point to anything: the bytes that implement the sin function, the number 42, the characters in "biscuits", or anything at all. WebAssembly is different in that its code is not addressable at run-time. Functions in a WebAssembly module are numbered sequentially from 0, and the WebAssembly call instruction takes the callee as an immediate parameter.

So, to add code to a WebAssembly program, somehow you'd have to augment the program with more functions. Let's assume we will make that possible somehow -- that your WebAssembly module that had N functions will now have N+1 functions, and with function N being the new one your program generated. How would we call it? Given that the call instructions hard-code the callee, the existing functions 0 to N-1 won't call it.

Here the answer is call_indirect. A bit of a reminder, this instruction take the callee as an operand, not an immediate parameter, allowing it to choose the callee function at run-time. The callee operand is an index into a table of functions. Conventionally, table 0 is called the indirect function table as it contains an entry for each function which might ever be the target of an indirect call.

With this in mind, our problem has two parts, then: (1) how to augment a WebAssembly module with a new function, and (2) how to get the original module to call the new code.

late linking of auxiliary webassembly modules

The key idea here is that to add code, the main program should generate a new WebAssembly module containing that code. Then we run a linking phase to actually bring that new code to life and make it available.

System linkers like ld typically require a complete set of symbols and relocations to resolve inter-archive references. However when performing a late link of JIT-generated code, we can take a short-cut: the main program can embed memory addresses directly into the code it generates. Therefore the generated module would import memory from the main module. All references from the generated code to the main module can be directly embedded in this way.

The generated module would also import the indirect function table from the main module. (We would ensure that the main module exports its memory and indirect function table via the toolchain.) When the main module makes the generated module, it also embeds a special patch function in the generated module. This function would add the new functions to the main module's indirect function table, and perform any relocations onto the main module's memory. All references from the main module to generated functions are installed via the patch function.

We plan on two implementations of late linking, but both share the fundamental mechanism of a generated WebAssembly module with a patch function.

dynamic linking via the run-time

One implementation of a linker is for the main module to cause the run-time to dynamically instantiate a new WebAssembly module. The run-time would provide the memory and indirect function table from the main module as imports when instantiating the generated module.

The advantage of dynamic linking is that it can update a live WebAssembly module without any need for re-instantiation or special run-time checkpointing support.

In the context of the web, JIT compilation can be triggered by the WebAssembly module in question, by calling out to functionality from JavaScript, or we can use a "pull-based" model to allow the JavaScript host to poll the WebAssembly instance for any pending JIT code.

For WASI deployments, you need a capability from the host. Either you import a module that provides run-time JIT capability, or you rely on the host to poll you for data.

static linking via wizer

Another idea is to build on Wizer's ability to take a snapshot of a WebAssembly module. You could extend Wizer to also be able to augment a module with new code. In this role, Wizer is effectively a late linker, linking in a new archive to an existing object.

Wizer already needs the ability to instantiate a WebAssembly module and to run its code. Causing Wizer to ask the module if it has any generated auxiliary module that should be instantiated, patched, and incorporated into the main module should not be a huge deal. Wizer can already run the patch function, to perform relocations to patch in access to the new functions. After having done that, Wizer (or some other tool) would need to snapshot the module, as usual, but also adding in the extra code.

As a technical detail, in the simplest case in which code is generated in units of functions which don't directly call each other, this is as simple as just appending the functions to the code section and then and appending the generated element segments to the main module's element segment, updating the appended function references to their new values by adding the total number of functions in the module before the new module was concatenated to each function reference.

late linking appears to be async codegen

From the perspective of a main program, WebAssembly JIT code generation via late linking appears the same as aynchronous code generation.

For example, take the C program:

struct Value;
struct Func {
  struct Expr *body;
  void *jitCode;
};

void recordJitCandidate(struct Func *func);
uint8_t* flushJitCode(); // Call to actually generate JIT code.

struct Value* interpretCall(struct Expr *body,
                            struct Value *arg);

struct Value* call(struct Func *func,
                   struct Value* val) {
  if (func->jitCode) {
    struct Value* (*f)(struct Value*) = jitCode;
    return f(val);
  } else {
    recordJitCandidate(func);
    return interpretCall(func->body, val);
  }
}

Here the C program allows for the possibility of JIT code generation: there is a slot in a Func instance to fill in with a code pointer. If this program generates code for a given Func, it won't be able to fill in the pointer -- it can't add new code to the image. But, it could tell Wizer to do so, and Wizer could snapshot the program, link in the new function, and patch &func->jitCode. From the program's perspective, it's as if the code becomes available asynchronously.

demo!

So many words, right? Let's see some code! As a sketch for other JIT compiler work, I implemented a little Scheme interpreter and JIT compiler, targetting WebAssembly. See interp.cc for the source. You compile it like this:

$ /opt/wasi-sdk/bin/clang++ -O2 -Wall \
   -mexec-model=reactor \
   -Wl,--growable-table \
   -Wl,--export-table \
   -DLIBRARY=1 \
   -fno-exceptions \
   interp.cc -o interplib.wasm

Here we are compiling with WASI SDK. I have version 14.

The -mexec-model=reactor argument means that this WASI module isn't just a run-once thing, after which its state is torn down; rather it's a multiple-entry component.

The two -Wl, options tell the linker to export the indirect function table, and to allow the indirect function table to be augmented by the JIT module.

The -DLIBRARY=1 is used by interp.cc; you can actually run and debug it natively but that's just for development. We're instead compiling to wasm and running with a WASI environment, giving us fprintf and other debugging niceties.

The -fno-exceptions is because WASI doesn't support exceptions currently. Also we don't need them.

WASI is mainly for non-browser use cases, but this module does so little that it doesn't need much from WASI and I can just polyfill it in browser JavaScript. So that's what we have here:

loading wasm-jit...

Each time you enter a Scheme expression, it will be parsed to an internal tree-like intermediate language. You can then run a recursive interpreter over that tree by pressing the "Evaluate" button. Press it a number of times, you should get the same result.

As the interpreter runs, it records any closures that it created. The Func instances attached to the closures have a slot for a C++ function pointer, which is initially NULL. Function pointers in WebAssembly are indexes into the indirect function table; the first slot is kept empty so that calling a NULL pointer (a pointer with value 0) causes an error. If the interpreter gets to a closure call and the closure's function's JIT code pointer is NULL, it will interpret the closure's body. Otherwise it will call the function pointer.

If you then press the "JIT" button above, the module will assemble a fresh WebAssembly module containing JIT code for the closures that it saw at run-time. Obviously that's just one heuristic: you could be more eager or more lazy; this is just a detail.

Although the particular JIT compiler isn't much of interest---the point being to see JIT code generation at all---it's nice to see that the fibonacci example sees a good speedup; try it yourself, and try it on different browsers if you can. Neat stuff!

not just the web

I was wondering how to get something like this working in a non-webby environment and it turns out that the Python interface to wasmtime is just the thing. I wrote a little interp.py harness that can do the same thing that we can do on the web; just run as `python3 interp.py`, after having `pip3 install wasmtime`:

$ python3 interp.py
...
Calling eval(0x11eb0) 5 times took 1.716s.
Calling jitModule()
jitModule result: <wasmtime._module.Module object at 0x7f2bef0821c0>
Instantiating and patching in JIT module
... 
Calling eval(0x11eb0) 5 times took 1.161s.

Interestingly it would appear that the performance of wasmtime's code (0.232s/invocation) is somewhat better than both SpiderMonkey (0.392s) and V8 (0.729s).

reflections

This work is just a proof of concept, but it's a step in a particular direction. As part of previous work with Fastly, we enabled the SpiderMonkey JavaScript engine to run on top of WebAssembly. When combined with pre-initialization via Wizer, you end up with a system that can start in microseconds: fast enough to instantiate a fresh, shared-nothing module on every HTTP request, for example.

The SpiderMonkey-on-WASI work left out JIT compilation, though, because, you know, WebAssembly doesn't support JIT compilation. JavaScript code actually ran via the C++ bytecode interpreter. But as we just found out, actually you can compile the bytecode: just-in-time, but at a different time-scale. What if you took a SpiderMonkey interpreter, pre-generated WebAssembly code for a user's JavaScript file, and then combined them into a single freeze-dried WebAssembly module via Wizer? You get the benefits of fast startup while also getting decent baseline performance. There are many engineering considerations here, but as part of work sponsored by Shopify, we have made good progress in this regard; details in another missive.

I think a kind of "offline JIT" has a lot of value for deployment environments like Shopify's and Fastly's, and you don't have to limit yourself to "total" optimizations: you can still collect and incorporate type feedback, and you get the benefit of taking advantage of adaptive optimization without having to actually run the JIT compiler at run-time.

But if we think of more traditional "online JIT" use cases, it's clear that relying on host JIT capabilities, while a good MVP, is not optimal. For one, you would like to be able to freely emit direct calls from generated code to existing code, instead of having to call indirectly or via imports. I think it still might make sense to have a language run-time express its generated code in the form of a WebAssembly module, though really you might want native support for compiling that code (asynchronously) from within WebAssembly itself, without calling out to a run-time. Most people I have talked to that work on WebAssembly implementations in JS engines believe that a JIT proposal will come some day, but it's good to know that we don't have to wait for it to start generating code and taking advantage of it.

& out

If you want to play around with the demo, do take a look at the wasm-jit Github project; it's fun stuff. Happy hacking, and until next time!

Andy Wingohttps://wingolog.org/fibs, lies, and benchmarkshttps://wingolog.org/2019/06/26/fibs-lies-and-benchmarks2019-06-26T10:34:11Z2019-06-26T10:34:11Z

Friends, consider the recursive Fibonacci function, expressed most lovelily in Haskell:

fib 0 = 0
fib 1 = 1
fib n = fib (n-1) + fib (n-2)

Computing elements of the Fibonacci sequence ("Fibonacci numbers") is a common microbenchmark. Microbenchmarks are like a Suzuki exercises for learning violin: not written to be good tunes (good programs), but rather to help you improve a skill.

The fib microbenchmark teaches language implementors to improve recursive function call performance.

I'm writing this article because after adding native code generation to Guile, I wanted to check how Guile was doing relative to other language implementations. The results are mixed. We can start with the most favorable of the comparisons: Guile present versus Guile of the past.


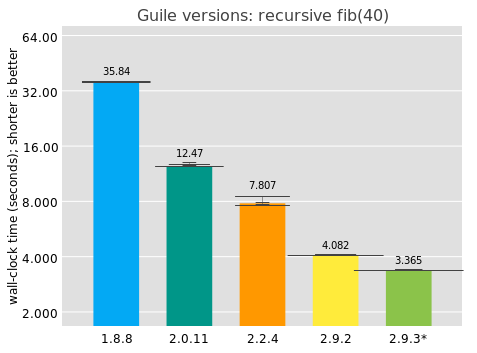
I collected these numbers on my i7-7500U CPU @ 2.70GHz 2-core laptop, with no particular performance tuning, running each benchmark 10 times, waiting 2 seconds between measurements. The bar value indicates the median elapsed time, and above each bar is an overlayed histogram of all results for that scenario. Note that the y axis is on a log scale. The 2.9.3* version corresponds to unreleased Guile from git.

Good news: Guile has been getting significantly faster over time! Over decades, true, but I'm pleased.

where are we? static edition

How good are Guile's numbers on an absolute level? It's hard to say because there's no absolute performance oracle out there. However there are relative performance oracles, so we can try out perhaps some other language implementations.

First up would be the industrial C compilers, GCC and LLVM. We can throw in a few more "static" language implementations as well: compilers that completely translate to machine code ahead-of-time, with no type feedback, and a minimal run-time.


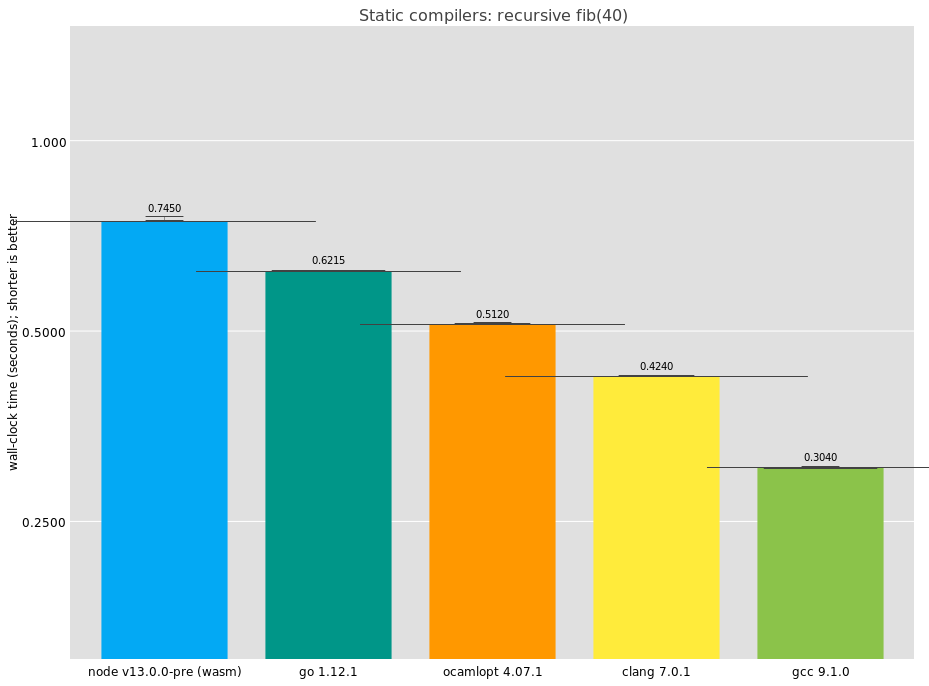
Here we see that GCC is doing best on this benchmark, completing in an impressive 0.304 seconds. It's interesting that the result differs so much from clang. I had a look at the disassembly for GCC and I see:

fib:
    push   %r12
    mov    %rdi,%rax
    push   %rbp
    mov    %rdi,%rbp
    push   %rbx
    cmp    $0x1,%rdi
    jle    finish
    mov    %rdi,%rbx
    xor    %r12d,%r12d
again:
    lea    -0x1(%rbx),%rdi
    sub    $0x2,%rbx
    callq  fib
    add    %rax,%r12
    cmp    $0x1,%rbx
    jg     again
    and    $0x1,%ebp
    lea    0x0(%rbp,%r12,1),%rax
finish:
    pop    %rbx
    pop    %rbp
    pop    %r12
    retq   

It's not quite straightforward; what's the loop there for? It turns out that GCC inlines one of the recursive calls to fib. The microbenchmark is no longer measuring call performance, because GCC managed to reduce the number of calls. If I had to guess, I would say this optimization doesn't have a wide applicability and is just to game benchmarks. In that case, well played, GCC, well played.

LLVM's compiler (clang) looks more like what we'd expect:

fib:
   push   %r14
   push   %rbx
   push   %rax
   mov    %rdi,%rbx
   cmp    $0x2,%rdi
   jge    recurse
   mov    %rbx,%rax
   add    $0x8,%rsp
   pop    %rbx
   pop    %r14
   retq   
recurse:
   lea    -0x1(%rbx),%rdi
   callq  fib
   mov    %rax,%r14
   add    $0xfffffffffffffffe,%rbx
   mov    %rbx,%rdi
   callq  fib
   add    %r14,%rax
   add    $0x8,%rsp
   pop    %rbx
   pop    %r14
   retq   

I bolded the two recursive calls.

Incidentally, the fib as implemented by GCC and LLVM isn't quite the same program as Guile's version. If the result gets too big, GCC and LLVM will overflow, whereas in Guile we overflow into a bignum. Also in C, it's possible to "smash the stack" if you recurse too much; compilers and run-times attempt to mitigate this danger but it's not completely gone. In Guile you can recurse however much you want. Finally in Guile you can interrupt the process if you like; the compiled code is instrumented with safe-points that can be used to run profiling hooks, debugging, and so on. Needless to say, this is not part of C's mission.

Some of these additional features can be implemented with no significant performance cost (e.g., via guard pages). But it's fair to expect that they have some amount of overhead. More on that later.

The other compilers are OCaml's ocamlopt, coming in with a very respectable result; Go, also doing well; and V8 WebAssembly via Node. As you know, you can compile C to WebAssembly, and then V8 will compile that to machine code. In practice it's just as static as any other compiler, but the generated assembly is a bit more involved:


fib_tramp:
    jmp    fib

fib:
    push   %rbp
    mov    %rsp,%rbp
    pushq  $0xa
    push   %rsi
    sub    $0x10,%rsp
    mov    %rsi,%rbx
    mov    0x2f(%rbx),%rdx
    mov    %rax,-0x18(%rbp)
    cmp    %rsp,(%rdx)
    jae    stack_check
post_stack_check:
    cmp    $0x2,%eax
    jl     return_n
    lea    -0x2(%rax),%edx
    mov    %rbx,%rsi
    mov    %rax,%r10
    mov    %rdx,%rax
    mov    %r10,%rdx
    callq  fib_tramp
    mov    -0x18(%rbp),%rbx
    sub    $0x1,%ebx
    mov    %rax,-0x20(%rbp)
    mov    -0x10(%rbp),%rsi
    mov    %rax,%r10
    mov    %rbx,%rax
    mov    %r10,%rbx
    callq  fib_tramp
return:
    mov    -0x20(%rbp),%rbx
    add    %ebx,%eax
    mov    %rbp,%rsp
    pop    %rbp
    retq   
return_n:
    jmp    return
stack_check:
    callq  WasmStackGuard
    mov    -0x10(%rbp),%rbx
    mov    -0x18(%rbp),%rax
    jmp    post_stack_check

Apparently fib compiles to a function of two arguments, the first passed in rsi, and the second in rax. (V8 uses a custom calling convention for its compiled WebAssembly.) The first synthesized argument is a handle onto run-time data structures for the current thread or isolate, and in the function prelude there's a check to see that the function has enough stack. V8 uses these stack checks also to handle interrupts, for when a web page is stuck in JavaScript.

Otherwise, it's a more or less normal function, with a bit more register/stack traffic than would be strictly needed, but pretty good.

do optimizations matter?

You've heard of Moore's Law -- though it doesn't apply any more, it roughly translated into hardware doubling in speed every 18 months. (Yes, I know it wasn't precisely that.) There is a corresponding rule of thumb for compiler land, Proebsting's Law: compiler optimizations make software twice as fast every 18 years. Zow!

The previous results with GCC and LLVM were with optimizations enabled (-O3). One way to measure Proebsting's Law would be to compare the results with -O0. Obviously in this case the program is small and we aren't expecting much work out of the optimizer, but it's interesting to see anyway:


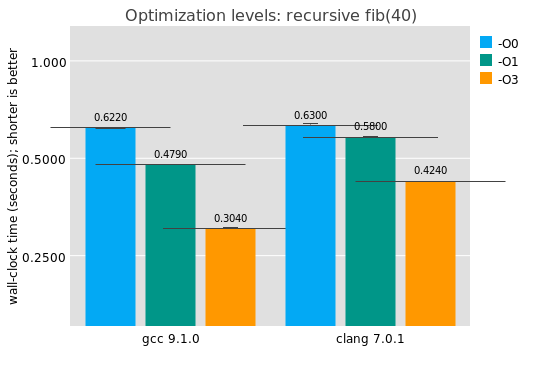
Answer: optimizations don't matter much for this benchark. This investigation does give a good baseline for compilers from high-level languages, like Guile: in the absence of clever trickery like the recursive inlining thing GCC does and in the absence of industrial-strength instruction selection, what's a good baseline target for a compiler? Here we see for this benchmark that it's somewhere between 420 and 620 milliseconds or so. Go gets there, and OCaml does even better.

how is time being spent, anyway?

Might we expect V8/WebAssembly to get there soon enough, or is the stack check that costly? How much time does one stack check take anyway? For that we'd have to determine the number of recursive calls for a given invocation.

Friends, it's not entirely clear to me why this is, but I instrumented a copy of fib, and I found that the number of calls in fib(n) was a more or less constant factor of the result of calling fib. That ratio converges to twice the golden ratio, which means that since fib(n+1) ~= φ * fib(n), then the number of calls in fib(n) is approximately 2 * fib(n+1). I scratched my head for a bit as to why this is and I gave up; the Lord works in mysterious ways.

Anyway for fib(40), that means that there are around 3.31e8 calls, absent GCC shenanigans. So that would indicate that each call for clang takes around 1.27 ns, which at turbo-boost speeds on this machine is 4.44 cycles. At maximum throughput (4 IPC), that would indicate 17.8 instructions per call, and indeed on the n > 2 path I count 17 instructions.

For WebAssembly I calculate 2.25 nanoseconds per call, or 7.9 cycles, or 31.5 (fused) instructions at max IPC. And indeed counting the extra jumps in the trampoline, I get 33 cycles on the recursive path. I count 4 instructions for the stack check itself, one to save the current isolate, and two to shuffle the current isolate into place for the recursive calls. But, compared to clang, V8 puts 6 words on the stack per call, as opposed to only 4 for LLVM. I think with better interprocedural register allocation for the isolate (i.e.: reserve a register for it), V8 could get a nice boost for call-heavy workloads.

where are we? dynamic edition

Guile doesn't aim to replace C; it's different. It has garbage collection, an integrated debugger, and a compiler that's available at run-time, it is dynamically typed. It's perhaps more fair to compare to languages that have some of these characteristics, so I ran these tests on versions of recursive fib written in a number of languages. Note that all of the numbers in this post include start-up time.


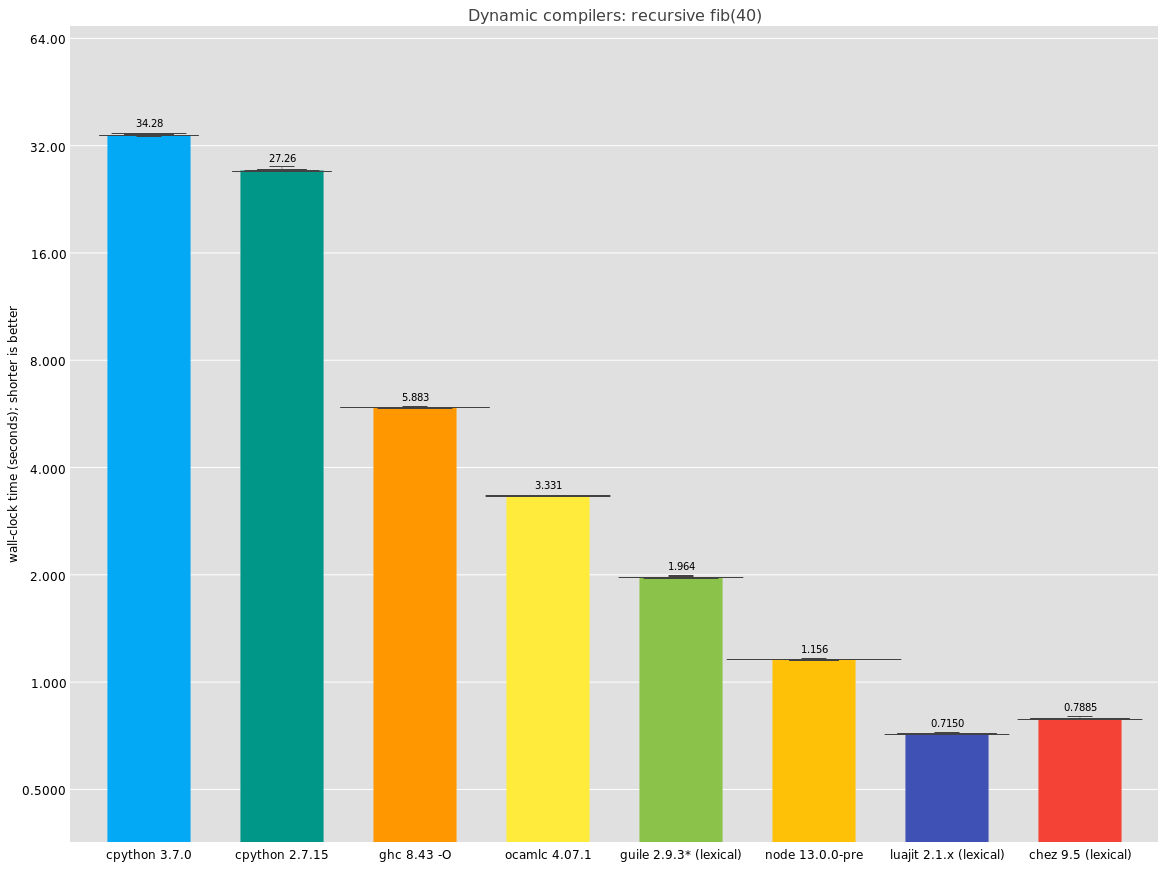
Here, the ocamlc line is the same as before, but using the bytecode compiler instead of the native compiler. It's a bit of an odd thing to include but it performs so well I just had to include it.

I think the real takeaway here is that Chez Scheme has fantastic performance. I have not been able to see the disassembly -- does it do the trick like GCC does? -- but the numbers are great, and I can see why Racket decided to rebase its implementation on top of it.

Interestingly, as far as I understand, Chez implements stack checks in the straightfoward way (an inline test-and-branch), not with a guard page, and instead of using the stack check as a generic ability to interrupt a computation in a timely manner as V8 does, Chez emits a separate interrupt check. I would like to be able to see Chez's disassembly but haven't gotten around to figuring out how yet.

Since I originally published this article, I added a LuaJIT entry as well. As you can see, LuaJIT performs as well as Chez in this benchmark.

Haskell's call performance is surprisingly bad here, beaten even by OCaml's bytecode compiler; is this the cost of laziness, or just a lacuna of the implementation? I do not know. I do know I have this mental image that Haskell is a good compiler but apparently if that's the standard, so is Guile :)

Finally, in this comparison section, I was not surprised by cpython's relatively poor performance; we know cpython is not fast. I think though that it just goes to show how little these microbenchmarks are worth when it comes to user experience; like many of you I use plenty of Python programs in my daily work and don't find them slow at all. Think of micro-benchmarks like x-ray diffraction; they can reveal the hidden substructure of DNA but they say nothing at all about the organism.

where to now?

Perhaps you noted that in the last graph, the Guile and Chez lines were labelled "(lexical)". That's because instead of running this program:

(define (fib n)
  (if (< n 2)
      n
      (+ (fib (- n 1)) (fib (- n 2)))))

They were running this, instead:

(define (fib n)
  (define (fib* n)
    (if (< n 2)
        n
        (+ (fib* (- n 1)) (fib* (- n 2)))))
  (fib* n))

The thing is, historically, Scheme programs have treated top-level definitions as being mutable. This is because you don't know the extent of the top-level scope -- there could always be someone else who comes and adds a new definition of fib, effectively mutating the existing definition in place.

This practice has its uses. It's useful to be able to go in to a long-running system and change a definition to fix a bug or add a feature. It's also a useful way of developing programs, to incrementally build the program bit by bit.


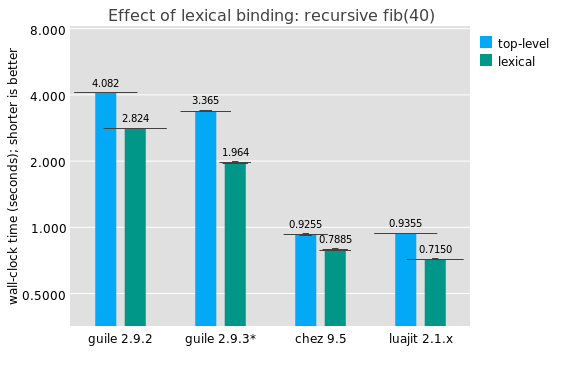
But, I would say that as someone who as written and maintained a lot of Scheme code, it's not a normal occurence to mutate a top-level binding on purpose, and it has a significant performance impact. If the compiler knows the target to a call, that unlocks a number of important optimizations: type check elision on the callee, more optimal closure representation, smaller stack frames, possible contification (turning calls into jumps), argument and return value count elision, representation specialization, and so on.

This overhead is especially egregious for calls inside modules. Scheme-the-language only gained modules relatively recently -- relative to the history of scheme -- and one of the aspects of modules is precisely to allow reasoning about top-level module-level bindings. This is why running Chez Scheme with the --program option is generally faster than --script (which I used for all of these tests): it opts in to the "newer" specification of what a top-level binding is.

In Guile we would probably like to move towards a more static way of treating top-level bindings, at least those within a single compilation unit. But we haven't done so yet. It's probably the most important single optimization we can make over the near term, though.

As an aside, it seems that LuaJIT also shows a similar performance differential for local function fib(n) versus just plain function fib(n).

It's true though that even absent lexical optimizations, top-level calls can be made more efficient in Guile. I am not sure if we can reach Chez with the current setup of having a template JIT, because we need two return addresses: one virtual (for bytecode) and one "native" (for JIT code). Register allocation is also something to improve but it turns out to not be so important for fib, as there are few live values and they need to spill for the recursive call. But, we can avoid some of the indirection on the call, probably using an inline cache associated with the callee; Chez has had this optimization since 1984!

what guile learned from fib

This exercise has been useful to speed up Guile's procedure calls, as you can see for the difference between the latest Guile 2.9.2 release and what hasn't been released yet (2.9.3).

To decide what improvements to make, I extracted the assembly that Guile generated for fib to a standalone file, and tweaked it in a number of ways to determine what the potential impact of different scenarios was. Some of the detritus from this investigation is here.

There were three big performance improvements. One was to avoid eagerly initializing the slots in a function's stack frame; this took a surprising amount of run-time. Fortunately the rest of the toolchain like the local variable inspector was already ready for this change.

Another thing that became clear from this investigation was that our stack frames were too large; there was too much memory traffic. I was able to improve this in the lexical-call by adding an optimization to elide useless closure bindings. Usually in Guile when you call a procedure, you pass the callee as the 0th parameter, then the arguments. This is so the procedure has access to its closure. For some "well-known" procedures -- procedures whose callers can be enumerated -- we optimize to pass a specialized representation of the closure instead ("closure optimization"). But for well-known procedures with no free variables, there's no closure, so we were just passing a throwaway value (#f). An unhappy combination of Guile's current calling convention being stack-based and a strange outcome from the slot allocator meant that frames were a couple words too big. Changing to allow a custom calling convention in this case sped up fib considerably.

Finally, and also significantly, Guile's JIT code generation used to manually handle calls and returns via manual stack management and indirect jumps, instead of using the platform calling convention and the C stack. This is to allow unlimited stack growth. However, it turns out that the indirect jumps at return sites were stalling the pipeline. Instead we switched to use call/return but keep our manual stack management; this allows the CPU to use its return address stack to predict return targets, speeding up code.

et voilà

Well, long article! Thanks for reading. There's more to do but I need to hit the publish button and pop this off my stack. Until next time, happy hacking!

Andy Wingohttps://wingolog.org/lightening run-time code generationhttps://wingolog.org/2019/05/24/lightening-run-time-code-generation2019-05-24T08:44:56Z2019-05-24T08:44:56Z

The upcoming Guile 3 release will have just-in-time native code generation. Finally, amirite? There's lots that I'd like to share about that and I need to start somewhere, so this article is about one piece of it: Lightening, a library to generate machine code.

on lightning

Lightening is a fork of GNU Lightning, adapted to suit the needs of Guile. In fact at first we chose to use GNU Lightning directly, "vendored" into the Guile source respository via the git subtree mechanism. (I see that in the meantime, git gained a kind of a subtree command; one day I will have to figure out what it's for.)

GNU Lightning has lots of things going for it. It has support for many architectures, even things like Itanium that I don't really care about but which a couple Guile users use. It abstracts the differences between e.g. x86 and ARMv7 behind a common API, so that in Guile I don't need to duplicate the JIT for each back-end. Such an abstraction can have a slight performance penalty, because maybe it missed the opportunity to generate optimal code, but this is acceptable to me: I was more concerned about the maintenance burden, and GNU Lightning seemed to solve that nicely.

GNU Lightning also has fantastic documentation. It's written in C and not C++, which is the right thing for Guile at this time, and it's also released under the LGPL, which is Guile's license. As it's a GNU project there's a good chance that GNU Guile's needs might be taken into account if any changes need be made.

I mentally associated Paolo Bonzini with the project, who I knew was a good no-nonsense hacker, as he used Lightning for a smalltalk implementation; and I knew also that Matthew Flatt used Lightning in Racket. Then I looked in the source code to see architecture support and was pleasantly surprised to see MIPS, POWER, and so on, so I went with GNU Lightning for Guile in our 2.9.1 release last October.

on lightening the lightning

When I chose GNU Lightning, I had in mind that it was a very simple library to cheaply write machine code into buffers. (Incidentally, if you have never worked with this stuff, I remember a time when I was pleasantly surprised to realize that an assembler could be a library and not just a program that processes text. A CPU interprets machine code. Machine code is just bytes, and you can just write C (or Scheme, or whatever) functions that write bytes into buffers, and pass those buffers off to the CPU. Now you know!)

Anyway indeed GNU Lightning 1.4 or so was that very simple library that I had in my head. I needed simple because I would need to debug any problems that came up, and I didn't want to add more complexity to the C side of Guile -- eventually I should be migrating this code over to Scheme anyway. And, of course, simple can mean fast, and I needed fast code generation.

However, GNU Lightning has a new release series, the 2.x series. This series is a rewrite in a way of the old version. On the plus side, this new series adds all of the weird architectures that I was pleasantly surprised to see. The old 1.4 didn't even have much x86-64 support, much less AArch64.

This new GNU Lightning 2.x series fundamentally changes the way the library works: instead of having a jit_ldr_f function that directly emits code to load a float from memory into a floating-point register, the jit_ldr_f function now creates a node in a graph. Before code is emitted, that graph is optimized, some register allocation happens around call sites and for temporary values, dead code is elided, and so on, then the graph is traversed and code emitted.

Unfortunately this wasn't really what I was looking for. The optimizations were a bit opaque to me and I just wanted something simple. Building the graph took more time than just emitting bytes into a buffer, and it takes more memory as well. When I found bugs, I couldn't tell whether they were related to my usage or in the library itself.

In the end, the node structure wasn't paying its way for me. But I couldn't just go back to the 1.4 series that I remembered -- it didn't have the architecture support that I needed. Faced with the choice between changing GNU Lightning 2.x in ways that went counter to its upstream direction, switching libraries, or refactoring GNU Lightning to be something that I needed, I chose the latter.

in which our protagonist cannot help himself

Friends, I regret to admit: I named the new thing "Lightening". True, it is a lightened Lightning, yes, but I am aware that it's horribly confusing. Pronounced like almost the same, visually almost identical -- I am a bad person. Oh well!!

I ported some of the existing GNU Lightning backends over to Lightening: ia32, x86-64, ARMv7, and AArch64. I deleted the backends for Itanium, HPPA, Alpha, and SPARC; they have no Debian ports and there is no situation in which I can afford to do QA on them. I would gladly accept contributions for PPC64, MIPS, RISC-V, and maybe S/390. At this point I reckon it takes around 20 hours to port an additional backend from GNU Lightning to Lightening.

Incidentally, if you need a code generation library, consider your choices wisely. It is likely that Lightening is not right for you. If you can afford platform-specific code and you need C, Lua's DynASM is probably the right thing for you. If you are in C++, copy the assemblers from a JavaScript engine -- C++ offers much more type safety, capabilities for optimization, and ergonomics.

But if you can only afford one emitter of JIT code for all architectures, you need simple C, you don't need register allocation, you want a simple library to just include in your source code, and you are good with the LGPL, then Lightening could be a thing for you. Check the gitlab page for info on how to test Lightening and how to include it into your project.

giving it a spin

Yesterday's Guile 2.9.2 release includes Lightening, so you can give it a spin. The switch to Lightening allowed us to lower our JIT optimization threshold by a factor of 50, letting us generate fast code sooner. If you try it out, let #guile on freenode know how it went. In any case, happy hacking!

Andy Wingohttps://wingolog.org/high-performance packet filtering with pfluahttps://wingolog.org/2014/09/02/high-performance-packet-filtering-with-pflua2014-09-02T10:15:49Z2014-09-02T10:15:49Z

Greets! I'm delighted to be able to announce the release of Pflua, a high-performance packet filtering toolkit written in Lua.

Pflua implements the well-known libpcap packet filtering language, which we call pflang for short.

Unlike other packet filtering toolkits, which tend to use the libpcap library to compile pflang expressions bytecode to be run by the kernel, Pflua is a completely new implementation of pflang.

why lua?

At this point, regular readers are asking themselves why this Schemer is hacking on a Lua project. The truth is that I've always been looking for an excuse to play with the LuaJIT high-performance Lua implementation.

LuaJIT is a tracing compiler, which is different from other JIT systems I have worked on in the past. Among other characteristics, tracing compilers only emit machine code for branches that are taken at run-time. Tracing seems a particularly appropriate strategy for the packet filtering use case, as you end up with linear machine code that reflects the shape of actual network traffic. This has the potential to be much faster than anything static compilation techniques can produce.

The other reason for using Lua was because it was an excuse to hack with Luke Gorrie, who for the past couple years has been building the Snabb Switch network appliance toolkit, also written in Lua. A common deployment environment for Snabb is within the host virtual machine of a virtualized server, with Snabb having CPU affinity and complete control over a high-performance 10Gbit NIC, which it then routes to guest VMs. The administrator of such an environment might want to apply filters on the kinds of traffic passing into and out of the guests. To this end, we plan on integrating Pflua into Snabb so as to provide a pleasant, expressive, high-performance filtering facility.

Given its high performance, it is also reasonable to deploy Pflua on gateway routers and load-balancers, within virtualized networking appliances.

implementation

Pflua compiles pflang expressions to Lua source code, which are then optimized at run-time to native machine code.

There are actually two compilation pipelines in Pflua. The main one is fairly traditional. First, a custom parser produces a high-level AST of a pflang filter expression. This AST is lowered to a primitive AST, with a limited set of operators and ways in which they can be combined. This representation is then exhaustively optimized, folding constants and tests, inferring ranges of expressions and packet offset values, hoisting assertions that post-dominate success continuations, etc. Finally, we residualize Lua source code, performing common subexpression elimination as we go.

For example, if we compile the simple Pflang expression ip or ip6 with the default compilation pipeline, we get the Lua source code:

return function(P,length)
   if not (length >= 14) then return false end
   do
      local v1 = ffi.cast("uint16_t*", P+12)[0]
      if v1 == 8 then return true end
      do
         do return v1 == 56710 end
      end
   end
end

The other compilation pipeline starts with bytecode for the Berkeley packet filter VM. Pflua can load up the libpcap library and use it to compile a pflang expression to BPF. In any case, whether you start from raw BPF or from a pflang expression, the BPF is compiled directly to Lua source code, which LuaJIT can gnaw on as it pleases. Compiling ip or ip6 with this pipeline results in the following Lua code:

return function (P, length)
   local A = 0
   if 14 > length then return 0 end
   A = bit.bor(bit.lshift(P[12], 8), P[12+1])
   if (A==2048) then goto L2 end
   if not (A==34525) then goto L3 end
   ::L2::
   do return 65535 end
   ::L3::
   do return 0 end
   error("end of bpf")
end

We like the independence and optimization capabilities afforded by the native pflang pipeline. Pflua can hoist and eliminate bounds checks, whereas BPF is obligated to check that every packet access is valid. Also, Pflua can work on data in network byte order, whereas BPF must convert to host byte order. Both of these restrictions apply not only to Pflua's BPF pipeline, but also to all other implementations that use BPF (for example the interpreter in libpcap, as well as the JIT compilers in the BSD and Linux kernels).

However, though Pflua does a good job in implementing pflang, it is inevitable that there may be bugs or differences of implementation relative to what libpcap does. For that reason, the libpcap-to-bytecode pipeline can be a useful alternative in some cases.

performance

When Pflua hits the sweet spots of the LuaJIT compiler, performance screams.


(full image, analysis)

This synthetic benchmark runs over a packet capture of a ping flood between two machines and compares the following pflang implementations:

  1. libpcap: The user-space BPF interpreter from libpcap

  2. linux-bpf: The old Linux kernel-space BPF compiler from 2011. We have adapted this library to work as a loadable user-space module (source)

  3. linux-ebpf: The new Linux kernel-space BPF compiler from 2014, also adapted to user-space (source)

  4. bpf-lua: BPF bytecodes, cross-compiled to Lua by Pflua.

  5. pflua: Pflang compiled directly to Lua by Pflua.

To benchmark a pflang implementation, we use the implementation to run a set of pflang expressions over saved packet captures. The result is a corresponding set of benchmark scores measured in millions of packets per second (MPPS). The first set of results is thrown away as a warmup. After warmup, the run is repeated 50 times within the same process to get multiple result sets. Each run checks to see that the filter matches the the expected number of packets, to verify that each implementation does the same thing, and also to ensure that the loop is not dead.

In all cases the same Lua program is used to drive the benchmark. We have tested a native C loop when driving libpcap and gotten similar results, so we consider that the LuaJIT interface to C is not a performance bottleneck. See the pflua-bench project for more on the benchmarking procedure and a more detailed analysis.

The graph above shows that Pflua can stream in packets from memory and run some simple pflang filters them at close to the memory bandwidth on this machine (100 Gbit/s). Because all of the filters are actually faster than the accept-all case, probably due to work causing prefetching, we actually don't know how fast the filters themselves can run. At any case, in this ideal situation, we're running at a handful of nanoseconds per packet. Good times!


(full image, analysis)

It's impossible to make real-world tests right now, especially since we're running over packet captures and not within a network switch. However, we can get more realistic. In the above test, we run a few filters over a packet capture from wingolog.org, which mostly operates as a web server. Here we see again that Pflua beats all of the competition. Oddly, the new Linux JIT appears to fare marginally worse than the old one. I don't know why that would be.

Sadly, though, the last tests aren't running at that amazing flat-out speed we were seeing before. I spent days figuring out why that is, and that's part of the subject of my last section here.

on lua, on luajit

I implement programming languages for a living. That doesn't mean I know everything there is to know about everything, or that everything I think I know is actually true -- in particular, I was quite ignorant about trace compilers, as I had never worked with one, and I hardly knew anything about Lua at all. With all of those caveats, here are some ignorant first impressions of Lua and LuaJIT.

LuaJIT has a ridiculously fast startup time. It also compiles really quickly: under a minute. Neither of these should be important but they feel important. Of course, LuaJIT is not written in Lua, so it doesn't have the bootstrap challenges that Guile has; but still, a fast compilation is refreshing.

LuaJIT's FFI is great. Five stars, would program again.

As a compilation target, Lua is OK. On the plus side, it has goto and efficient bit operations over 32-bit numbers. However, and this is a huge downer, the result range of bit operations is the signed int32 range, not the unsigned range. This means that bit.band(0xffffffff, x) might be negative. No one in the history of programming has ever wanted this. There are sensible meanings for negative results to bit operations, but only if an argument was negative. Grr. Otherwise, Lua shares the same concerns as other languages whose numbers are defined as 64-bit doubles.

Sometimes people get upset that Lua starts its indexes (in "arrays" or strings) with 1 instead of 0. It's foreign to me, so it's sometimes a challenge, but it can work as well as anything else. The problem comes in when working with the LuaJIT FFI, which starts indexes with 0, leading me to make errors as I forget which kind of object I am working on.

As a language to implement compilers, Lua desperately misses a pattern matching facility. Otherwise, a number of small gripes but no big ones; tables and closures abound, which leads to relatively terse code.

Finally, how well does trace compilation work for this task? I offer the following graph.


(full image, analysis)

Here the tests are paired. The first test of a pair, for example the leftmost portrange 0-6000, will match most packets. The second test of a pair, for example the second-from-the-left portrange 0-5, will reject all packets. The generated Lua code will be very similar, except for some constants being different. See portrange-0-6000.md for an example.

The Pflua performance of these filters is very different: the one that matches is slower than the one that doesn't, even though in most cases the non-matching filter will have to do more work. For example, a non-matching filter probably checks both src and dst ports, whereas a successful one might not need to check the dst.

It hurts to see Pflua's performance be less than the Linux JIT compilers, and even less than libpcap at times. I scratched my head for a long time about this. The Lua code is fine, and actually looks much like the BPF code. I had taken a look at the generated assembly code for previous traces and it looked fine -- some things that were not as good as they should be (e.g. a fair bit of conversions between integers and doubles, where these traces have no doubles), but things were OK. What changed?

Well. I captured the traces for portrange 0-6000 to a file, and dove in. Trace 66 contains the inner loop. It's interesting to see that there's a lot of dynamic checks in the beginning of the trace, although the loop itself is not bad (scroll down to see the word LOOP:), though with the double conversions I mentioned before.

It seems that trace 66 was captured for a packet whose src port was within range. Later, we end up compiling a second trace if the src port check fails: trace 67. The trace starts off with an absurd amount of loads and dynamic checks -- to a similar degree as trace 66, even though trace 66 dominates trace 67. It seems that there is a big penalty for transferring from one trace to another, even though they are both compiled.

Finally, once trace 67 is done -- and recall that all it has to do is check the destination port, and then update the counters from the inner loop) -- it jumps back to the top of trace 66 instead of the top of the loop, repeating all of the dynamic checks in trace 66! I can only think this is a current deficiency of LuaJIT, and not with trace compilation in general, although the amount of state transfer points to a lack of global analysis that you would get in a method JIT. I'm sure that values are being transferred that are actually dead.

This explains the good performance for the match-nothing cases: the first trace that gets compiled residualizes the loop expecting that all tests fail, and so only matching cases or variations incur the trace transfer-and-re-loop cost.

It could be that the Lua code that Pflua residualizes is in some way not idiomatic or not performant; tips in that regard are appreciated.

conclusion

I was going to pass some possible slogans by our marketing department, but we don't really have one, so I pass them on to you and you can tell me what you think:

  • "Pflua: A Totally Adequate Pflang Implementation"

  • "Pflua: Sometimes Amazing Performance!!!!1!!"

  • "Pflua: Organic Artisanal Network Packet Filtering"

Pflua was written by Igalians Diego Pino, Javier Muñoz, and myself for Snabb Gmbh, fine purveyors of high-performance networking solutions. If you are interested in getting Pflua in a Snabb context, we'd be happy to talk; drop a note to the snabb-devel forum. For Pflua in other contexts, file an issue or drop me a mail at wingo@igalia.com. Happy hackings with Pflua, the totally adequate pflang implementation!

Andy Wingohttps://wingolog.org/security implications of jit compilationhttps://wingolog.org/2011/06/21/security-implications-of-jit-compilation2011-06-21T17:00:25Z2011-06-21T17:00:25Z

Periodically the tubes alight with statements that just-in-time (JIT) compilers are somehow bad for security. At Igalia we work with many companies that have put or are interested in putting JIT compilers on mobile devices, and obviously security is one of their concerns. In this article I'd like to take a closer look at the risks and myths surrounding JIT and security.

executive summary

JIT compilers do not cause a significant security risk in and of themselves.

However, JIT compilers do allow flaws in unsafe native libraries to be more easily exploited.

The problem is not JIT compilation. The problem is code written in unsafe languages.

a background: interpreters and security

It used to be that JavaScript implementations all used interpreters to execute JavaScript code, usually in bytecode form. An interpreter is a program, usually written in C or C++, which interprets program code as data.

(I will take JavaScript as the example in this article, though similar considerations apply to other language implementations.)

JavaScript implementations also includes a language runtime, which implements all of the "primitive" objects of the language. In this case of JavaScript this might include Date objects and such. The runtime also includes a garbage collector, a parser, and other such things.

Sometimes interpreters are used to run "external" code, as is the case with JavaScript. In that case the language implementation is a fairly clear attack target: the attacker tries to produce an input which triggers a flaw in the language implementation, allowing takeover of the target system.

Note that in this case, the interpreter itself is only part of the target. Indeed the interpreter is typically only a small part of a language implementation, and is very well-tested. Usually the vulnerability is in some bit of the runtime, and often stems from having the runtime written in an unsafe language like C or C++.

So the interpreter part itself typically imposes no risk, beyond the obvious ones of interpreting data provided by an attacker.

compilers have more moving pieces

Instead of interpreting a program as data, compilers produce native code. A compiler is bigger than an interpreter, and so exposes a larger attack surface. A compiler usually has more corner cases than an interpreter, which often are not tested properly. Compilers are usually specific to particular target architectures, which makes bugs in less-used architectures more likely. Additionally, by generating native code, a compiler operates outside whatever meager safety guarantees are provide by the implementation language (C or C++).

So yes, compilers are a risk, JIT or otherwise. However with proper testing it is possible to have confidence in a compiler. First of all, a compiler is written by compiler writers, not ordinary programmers, and not attackers. Secondly a compiler is generally a functional process, so it's easy to test. Modern JS implementations have thousands and thousands of tests. It's still a cross-your-fingers-and-pray thing, usually, but the fact is that exploits these days come from bugs present in the source of unsafe languages, not bugs in code generated from safe languages.

jit compilation allows performant mobile code

JIT compilation can actually increase the overall security of a system, if one of the design goals of that system is user-installable "apps". For example, Android apps are (typically) written in Java, targetting the Dalvik VM. This choice of safe language and safe runtime largely eliminates the need to make a tight sandbox around apps. If it weren't for the presence of unsafe code in the libraries available to an Android app, things would be even easier.

Note that Dalvik's JIT has other positive security characteristics, in that its generated code can be verified against the bytecodes that it is supposed to implement. I recommend this video for a good discussion; thanks to my colleague Xan for pointing it out.

In contrast, Apple's decision to allow natively-compiled applications to be installed by users leaves them scrambling to try to mitigate the effects of what happens when an app has a buffer overflow. Again, the problem is unsafe code, not JIT compilation.

attempts to contain security vulnerabilities in unsafe code

That said, unsafe languages are part of the sordid reality, so let's look at how attackers compromise such applications.

In the old days, once you got a stack buffer overflow, you just wrote whatever code you wanted onto the stack, and arranged for a function return to execute that code. Smashing the stack for fun and profit, you see.

These days it is more difficult. One of the things that makes it more difficult is making it impossible to write code which is later executed. This technique goes under various names: the NX bit, DEP, W⊕X, etc. Basically it means you can't write shellcode. But, you can return to libc, which uses existing functions in libc (like system).

Some systems also prevent you from running code on disk unless it is signed. Dion Blazakis wrote a nice overview on the sandbox in iOS devices (subtitle: using Scheme for evil). Besides not letting you write code for your own device -- a terrible thing IMO, but not related to security -- this technique does prevent attackers from getting around the NX restriction by writing code to disk, then executing it.

But one need not write code to perform arbitrary computation. I assume everyone's seen the following papers, and if not, I highly recommend them:

Finally, instead of loading libc always at the same place, the latest thing to happen is to randomize the positions at which the various segments are loaded in memory. This is called Address Space Layout Randomization (ASLR). To effectively execute a return to libc under ASLR, you have to figure out where libc is first; not a trivial task.

I think I need to mention again that these are not security measures per se. If you are really interested in security, don't write systems software in unsafe languages. These measures are designed to contain the effects of a vulnerability.

I should also note that all of these measures are actively harmful to people writing code. ASLR increases load time by disallowing prelinking of various sorts, and forcing the generation of position-independent code. Disallowing writable, executable memory means that you can't do JIT compilation, not to mention quajects. Disallowing unsigned binaries means that you can't run your code on your own device.

jit compilation is not compatible with these restrictions

Having a JIT compiler by definition means that you are writing code and then going to run it. This makes it easier for an attacker who has found a bug in a native library to exploit it.

These exploits do happen, though currently not very often. A good example of such a paper is Interpreter Exploitation: Pointer Inference And JIT Spraying by Dion Blazakis.

Blazakis uses characteristics of the language runtime (Flash, in that case) to allow him to determine the address ranges to write his code. The actual code is written by taking advantage of the predictable output of the particular JIT in question to spray a big NOPsled onto the heap, which if I understand it correctly, is implemented by starting the IP in the middle of x86 instructions, in lovely contrapuntal style. Very clever stuff.

But again, the vulnerability is present not in code related to the JIT, but in native code. Having executable pages makes the vulnerability easier to exploit, but is not itself the security risk.

specific jit implementations

I called out Dalvik as an example of a JIT implementation that is particularly security-conscious. As much as I like V8, though, I cannot recommend it particularly, from the security perspective. It is simply changing too fast. Practically every commit touches code generators. The individual architectures share some pieces but duplicate a lot. I cannot speak for the other JavaScript implementations, as I do not know them as well.

V8's primary use case in the Chromium browser does have some security safeguards though, benefitting from the process sandbox and rapid release cycle. But I would be hesitant to put it in a device, lacking the same safeguards.

mitigations for jit vulnerabilities

These days all signs are pointing to the end of sandboxing as a security strategy, replacing it instead with verification and software fault isolation (SFI). Google's Native Client group is leading the way here. For more, see Adapting software fault isolation to contemporary CPU architectures by Sehr et al. But it does seem a poor thing to try to turn an unsafe language into a "fault-isolated" runtime; better to start with safe code to begin with.

Adapting SFI to JIT compilers could protect against flaws in JIT compilers, but it has abysmal results. The authors of that paper adapted V8 to produce the code sequences needed to preserve the SFI invariants, and got killed in speed. They somehow managed to claim success though, which is beyond me.

in closing

If you've already decided that you're going to ship remotely exploitable libraries written in unsafe languages, disallowing JIT can indeed reduce your attack surface. I understand it in some cases. But it is a shame to make safe languages pay the sins of their unsafe brethren. If you can, be Android, and not iOS.