understanding webassembly code generation throughput
Greets! Today's article looks at browser WebAssembly implementations from a compiler throughput point of view. As I wrote in my article on Firefox's WebAssembly baseline compiler, web browsers have multiple wasm compilers: some that produce code fast, and some that produce fast code. Implementors are willing to pay the cost of having multiple compilers in order to satisfy these conflicting needs. So how well do they do their jobs? Why bother?
In this article, I'm going to take the simple path and just look at code generation throughput on a single chosen WebAssembly module. Think of it as X-ray diffraction to expose aspects of the inner structure of the WebAssembly implementations in SpiderMonkey (Firefox), V8 (Chrome), and JavaScriptCore (Safari).
experimental setup
As a workload, I am going to use a version of the "Zen Garden" demo. This is a 40-megabyte game engine and rendering demo, originally released for other platforms, and compiled to WebAssembly a couple years later. Unfortunately the original URL for the demo was disabled at some point in late 2019, so it no longer has a home on the web. A bit of a weird situation and I am not clear on licensing either. In any case I have a version downloaded, and have hacked out a minimal set of "imports" that the WebAssembly module needs from the host to allow the module to compile and link when run from a JavaScript shell, without requiring WebGL and similar facilities. So the benchmark is just to instantiate a WebAssembly module from the 40-megabyte byte array and see how long it takes. It would be better if I had more test cases (and would be happy to add them to the comparison!) but this is a start.
I start by benchmarking the various WebAssembly implementations, firstly in their standard configuration and then setting special run-time flags to measure the performance of the component compilers. I run these tests on the core-rich machine that I use for browser development (2 Xeon Silver 4114 CPUs for a total of 40 logical cores). The default-configuration numbers are therefore not indicative of performance on a low-end Android phone, but we can use them to extract aspects of the different implementations.
Since I'm interested in compiler throughput, I'm not particularly concerned about how well a compiler will use all 40 cores. Therefore when testing the specific compilers I will set implementation-specific flags to disable parallelism in the compiler and GC: --single-threaded on V8, --no-threads on SpiderMonkey, and --useConcurrentGC=false --useConcurrentJIT=false on JSC. To further restrict any threads that the implementation might decide to spawn, I'll bind these to a single core on my machine using taskset -c 4. Otherwise the machine is in its normal configuration (nothing else significant running, all cores available for scheduling, turbo boost enabled).
I'll express results in nanoseconds per WebAssembly code byte. Of the 40 megabytes or so in the Zen Garden demo, only 23 891 164 bytes are actually function code; the rest is mostly static data (textures and so on). So I'll divide the total time by this code byte count.
I tested V8 at git revision 0961376575206, SpiderMonkey at hg revision 8ec2329bef74, and JavaScriptCore at subversion revision 259633. The benchmarks can be run using just a shell; see the pull request. I timed how long it took to instantiate the Zen Garden demo, ensuring that a basic export was callable. I collected results from 20 separate runs, sleeping a second between them. The bars in the charts below show the median times, with a histogram overlay of all results.
results & analysis
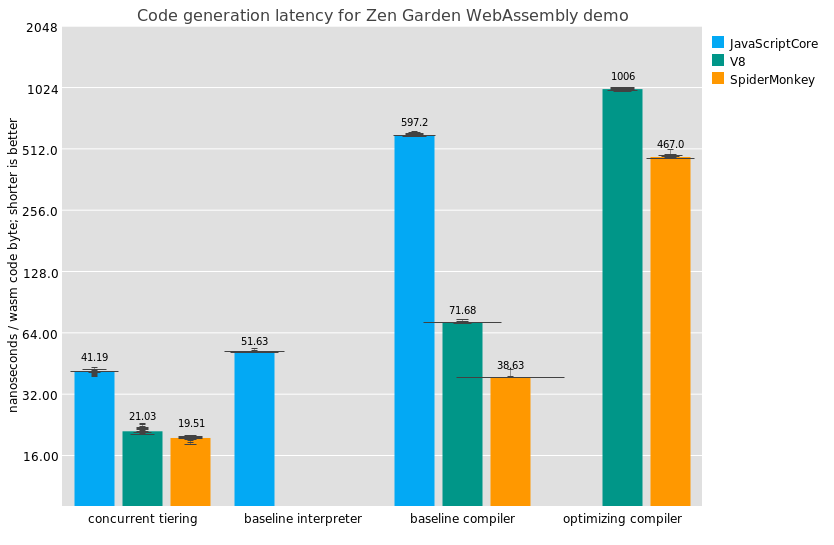
We can see some interesting results in this graph. Note that the Y axis is logarithmic. The "concurrent tiering" results in the graph correspond to the default configurations (no special flags, no taskset, all cores available).
The first interesting conclusions that pop out for me concern JavaScriptCore, which is the only implementation to have a baseline interpreter (run using --useWasmLLInt=true --useBBQJIT=false --useOMGJIT=false). JSC's WebAssembly interpreter is actually structured as a compiler that generates custom WebAssembly-specific bytecode, which is then run by a custom interpreter built using the same infrastructure as JSC's JavaScript interpreter (the LLInt). Directly interpreting WebAssembly might be possible as a low-latency implementation technique, but since you need to validate the WebAssembly anyway and eventually tier up to an optimizing compiler, apparently it made sense to emit fresh bytecode.
The part of JSC that generates baseline interpreter code runs slower than SpiderMonkey's baseline compiler, so one is tempted to wonder why JSC bothers to go the interpreter route; but then we recall that on iOS, we can't generate machine code in some contexts, so the LLInt does appear to address a need.
One interesting feature of the LLInt is that it allows tier-up to the optimizing compiler directly from loops, which neither V8 nor SpiderMonkey support currently. Failure to tier up can be quite confusing for users, so good on JSC hackers for implementing this.
Finally, while baseline interpreter code generation throughput handily beats V8's baseline compiler, it would seem that something in JavaScriptCore is not adequately taking advantage of multiple cores; if one core compiles at 51ns/byte, why do 40 cores only do 41ns/byte? It could be my tests are misconfigured, or it could be that there's a nice speed boost to be found somewhere in JSC.
JavaScriptCore's baseline compiler (run using --useWasmLLInt=false --useBBQJIT=true --useOMGJIT=false) runs much more slowly than SpiderMonkey's or V8's baseline compiler, which I think can be attributed to the fact that it builds a graph of basic blocks instead of doing a one-pass compile. To me these results validate SpiderMonkey's and V8's choices, looking strictly from a latency perspective.
I don't have graphs for code generation throughput of JavaSCriptCore's optimizing compiler (run using --useWasmLLInt=false --useBBQJIT=false --useOMGJIT=true); it turns out that JSC wants one of the lower tiers to be present, and will only tier up from the LLInt or from BBQ. Oh well!
V8 and SpiderMonkey, on the other hand, are much of the same shape. Both implement a streaming baseline compiler and an optimizing compiler; for V8, we get these via --liftoff --no-wasm-tier-up or --no-liftoff, respectively, and for SpiderMonkey it's --wasm-compiler=baseline or --wasm-compiler=ion.
Here we should conclude directly that SpiderMonkey generates code around twice as fast as V8 does, in both tiers. SpiderMonkey can generate machine code faster even than JavaScriptCore can generate bytecode, and optimized machine code faster than JSC can make baseline machine code. It's a very impressive result!
Another conclusion concerns the efficacy of tiering: for both V8 and SpiderMonkey, their baseline compilers run more than 10 times as fast as the optimizing compiler, and the same ratio holds between JavaScriptCore's baseline interpreter and compiler.
Finally, it would seem that the current cross-implementation benchmark for lowest-tier code generation throughput on a desktop machine would then be around 50 ns per WebAssembly code byte for a single core, which corresponds to receiving code over the wire at somewhere around 160 megabits per second (Mbps). If we add in concurrency and manage to farm out compilation tasks well, we can obviously double or triple that bitrate. Optimizing compilers run at least an order of magnitude slower. We can conclude that to the desktop end user, WebAssembly compilation time is indistinguishable from download time for the lowest tier. The optimizing tier is noticeably slower though, running more around 10-15 Mbps per core, so time-to-tier-up is still a concern for faster networks.
Going back to the question posed at the start of the article: yes, tiering shows a clear benefit in terms of WebAssembly compilation latency, letting users interact with web sites sooner. So that's that. Happy hacking and until next time!
One response
Comments are closed.
Thank you for the great article!
There’s only one thing that got me stumbling: You talk about JSC not using multiple cores well but I thought you had forced all tests on a single core. Did a paragraph go missing there which explained that you did a second test?